Connect Dashboard
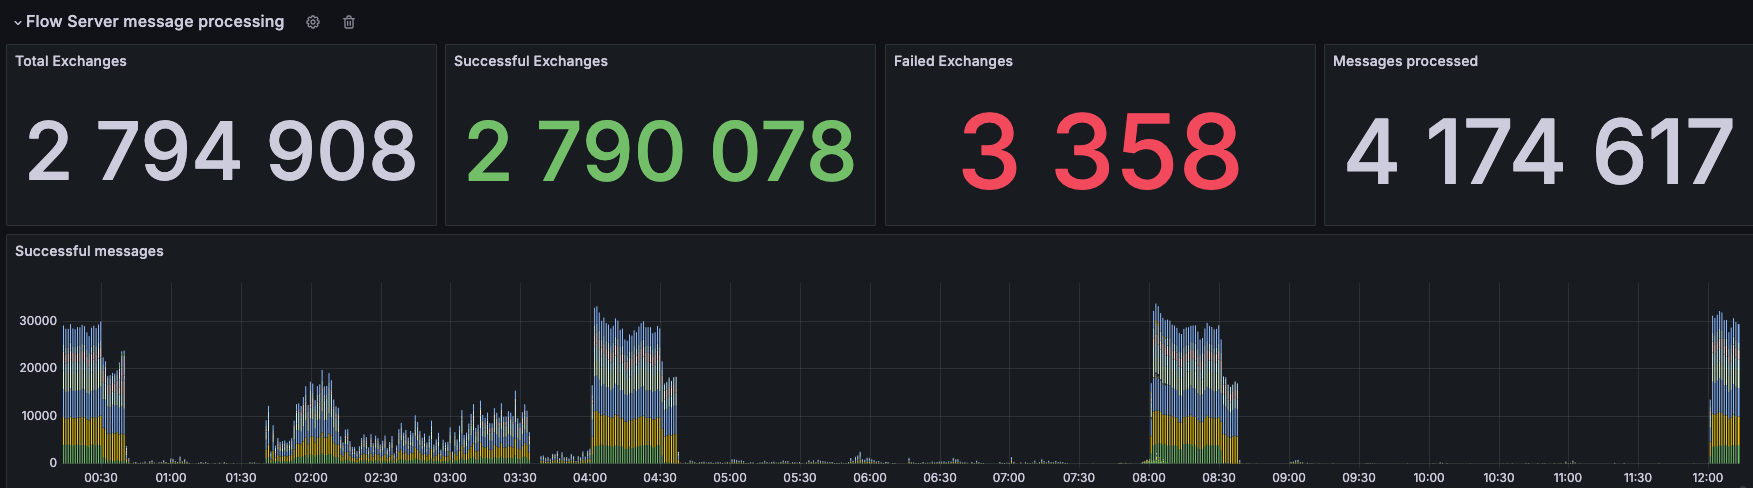
The Connect dashboard displays both business and technical metrics. It provides an overview of message processing activity, organized by flow. These metrics help you identify potential integration issues, such as a high number of failed messages, and understand the system load for the selected time period.
Inflight, Buffered, and Stashed Messages
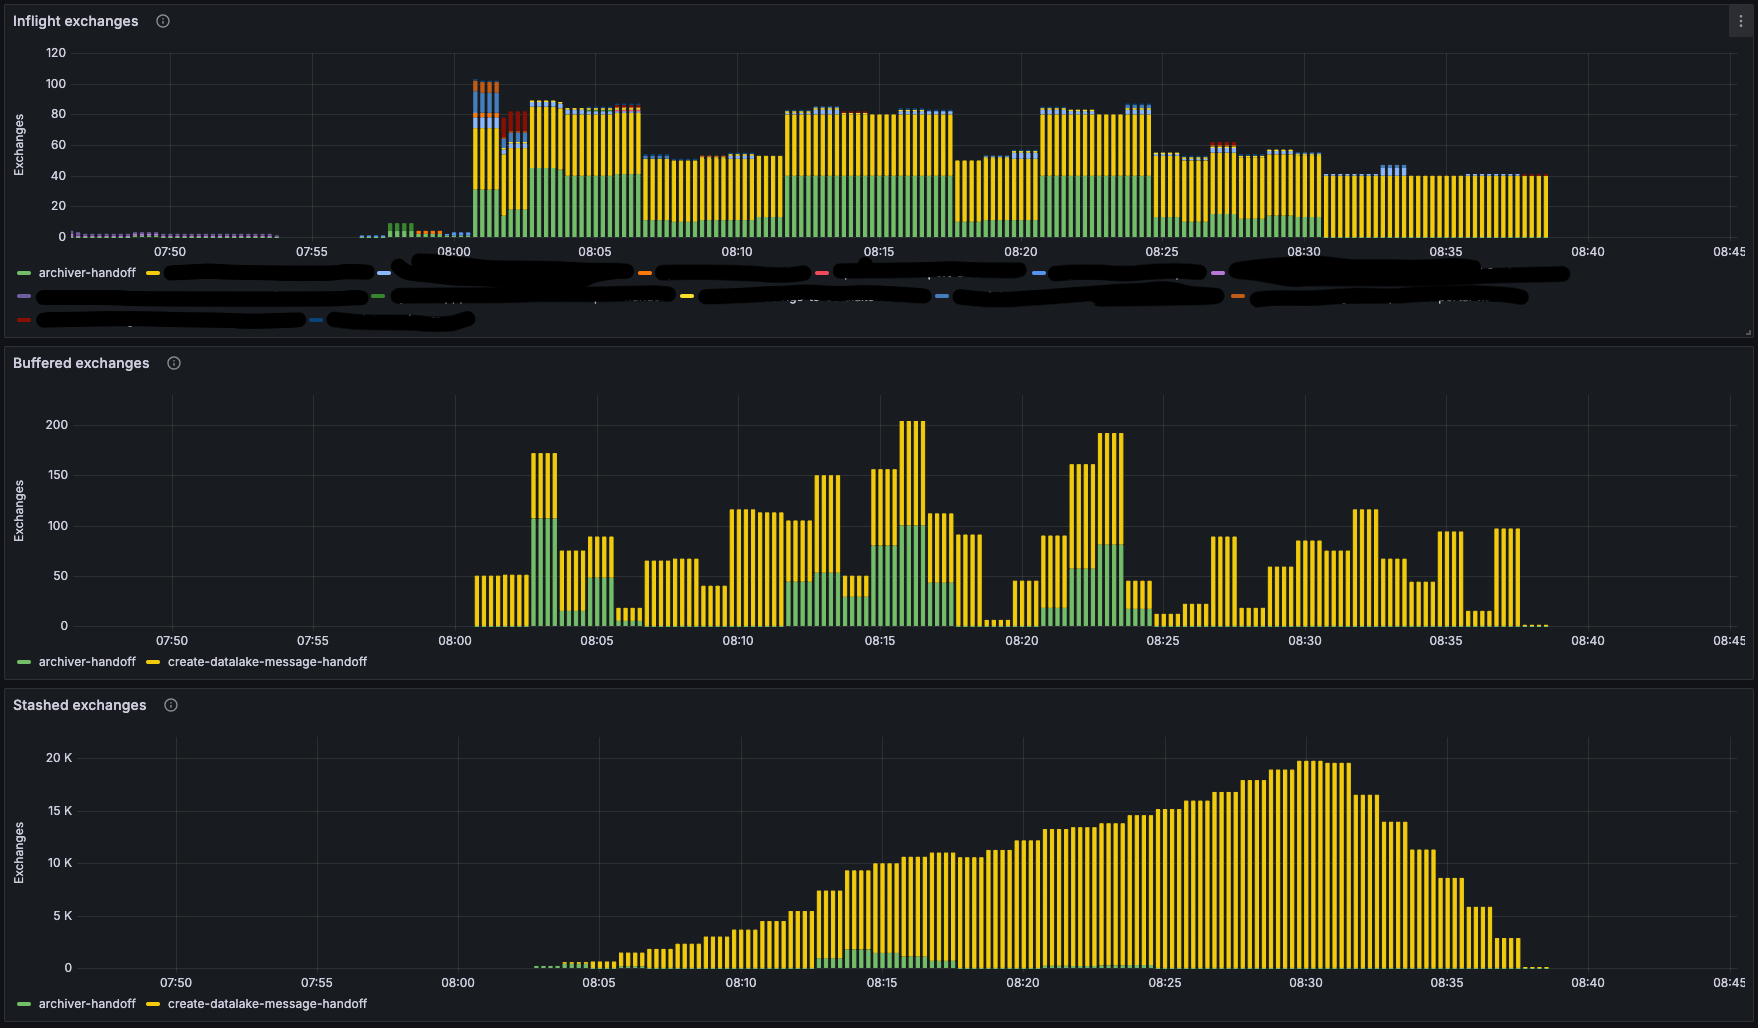
Three panels display inflight, buffered, and stashed messages. These panels are key tools for monitoring integration traffic and can help identify potential flow misconfigurations.
Connect persists all incoming messages. A limited number of messages are processed concurrently, while additional messages are buffered in memory. When the buffer reaches its limit, persisted messages are no longer held in memory. These are referred to as stashed messages. Stashed messages must be read back from persistence once buffer space becomes available before they can be processed.
A consistently high inflight message count does not always indicate a problem, but it can indicate inefficient configuration. For large messages in particular, high inflight counts consume significant memory and should be monitored closely.
If the buffer remains full for extended periods, it indicates a configuration issue. Buffered messages stay in memory to handle short bursts of load without reading from persistence. During extended periods of high load, the buffer can fill up, causing messages to move to the stash. In this situation, the buffer continues to consume memory, but you must refill it periodically from stash. This eliminates the performance benefit of keeping messages in memory.
If you observe consistently high numbers of both buffered and stashed messages, review your buffer configuration. In some cases, reducing the buffer size may improve overall performance. For guidance on how to configure and tune these settings, see Throttling in Design A Flow.
Processing and Persistence Time
The panels displaying processing and persistence times are useful for identifying performance issues. When Connect is under heavy load, the persistence provider can sometimes become the main bottleneck. Monitoring average persistence time can help determine whether this is the case.
If processing time per message is high, it may indicate problematic processors, for example, a suboptimal map implementation.
