Ecosystems
|
Ghostwriter is an accelerator specific to power utilities. When enabled, it can be accessed via the menu button ( |
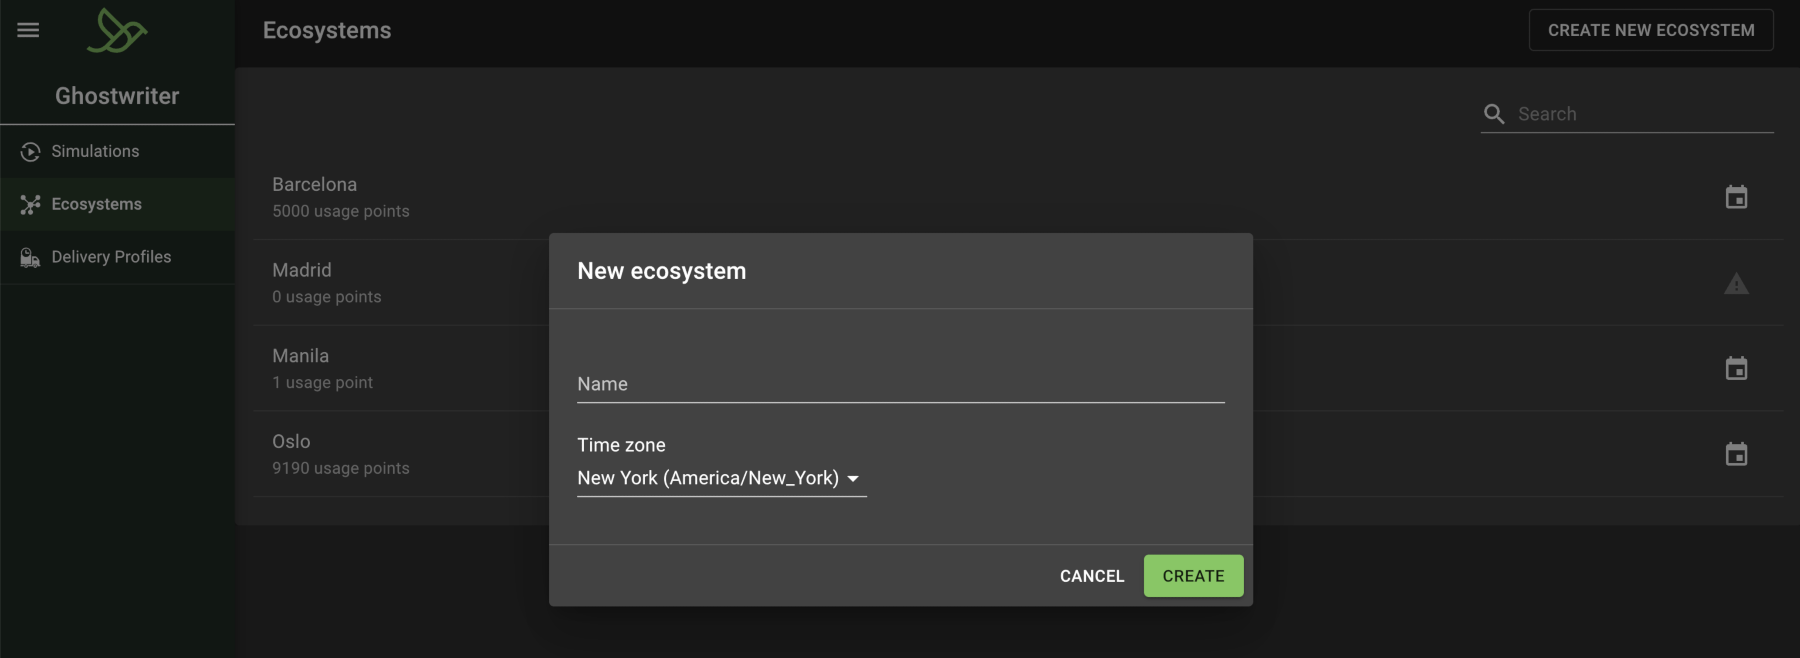
Ecosystems represent an area on the map where simulated meter readings will take place. To create a new ecosystem, select the Ecosystems tab on the left, then select the "Create New Ecosystem" button in the top-right corner. You will see the following form to specify a name and time zone:
Usage Points
After the ecosystem is created, you will need to add usage points (i.e., meter reading locations) to it. This can be done automatically by selecting the "Generate Points" button, which will display the following map:
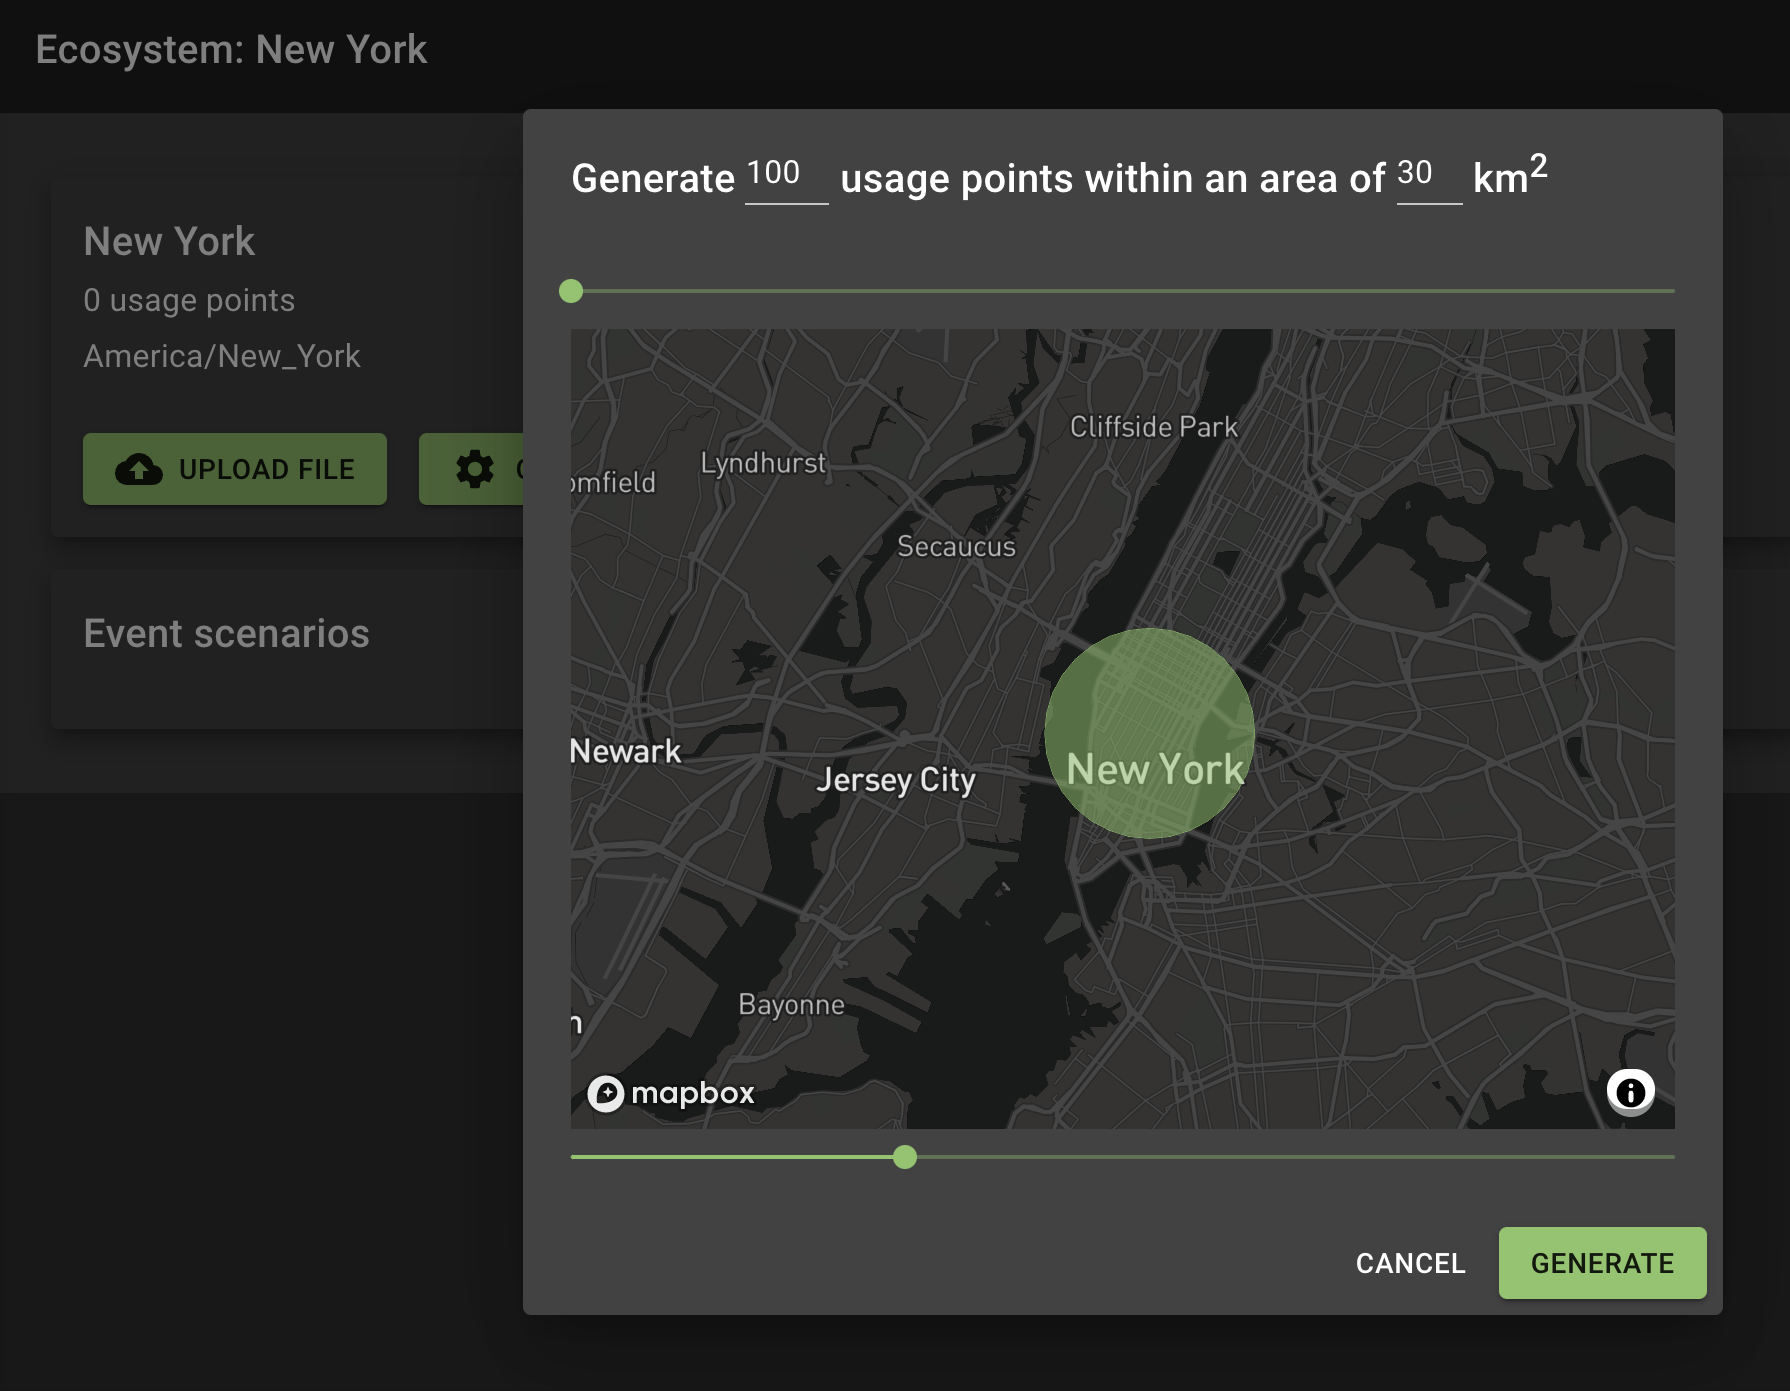
Click on the map to set the center of the circle and use the sliders to adjust the size of the area and number of usage points to create within.
You can also upload a CSV file instead, where each line of the file would need to have the following data:
id,type,profile,coordSystem;lat;lon,city,address,zip
A complete example would look like the following:
METER-1234,type-1,Basic24hActive,L.CRS.EPSG3857;40.7580;-73.9855,Manhattan,Times Square,10036
| Once you’ve created the usage points, you cannot edit them and will need to delete the ecosystem and/or create a new one. |
Events
Events are negative effects like a power outage or corrupt reading that you would want to test your flows against. Ecosystems must have at least one event added to them before a simulation can be run.
To add an event, select the "Create New Event Scenario" button in the top-right corner of the screen. This will bring up the following form:
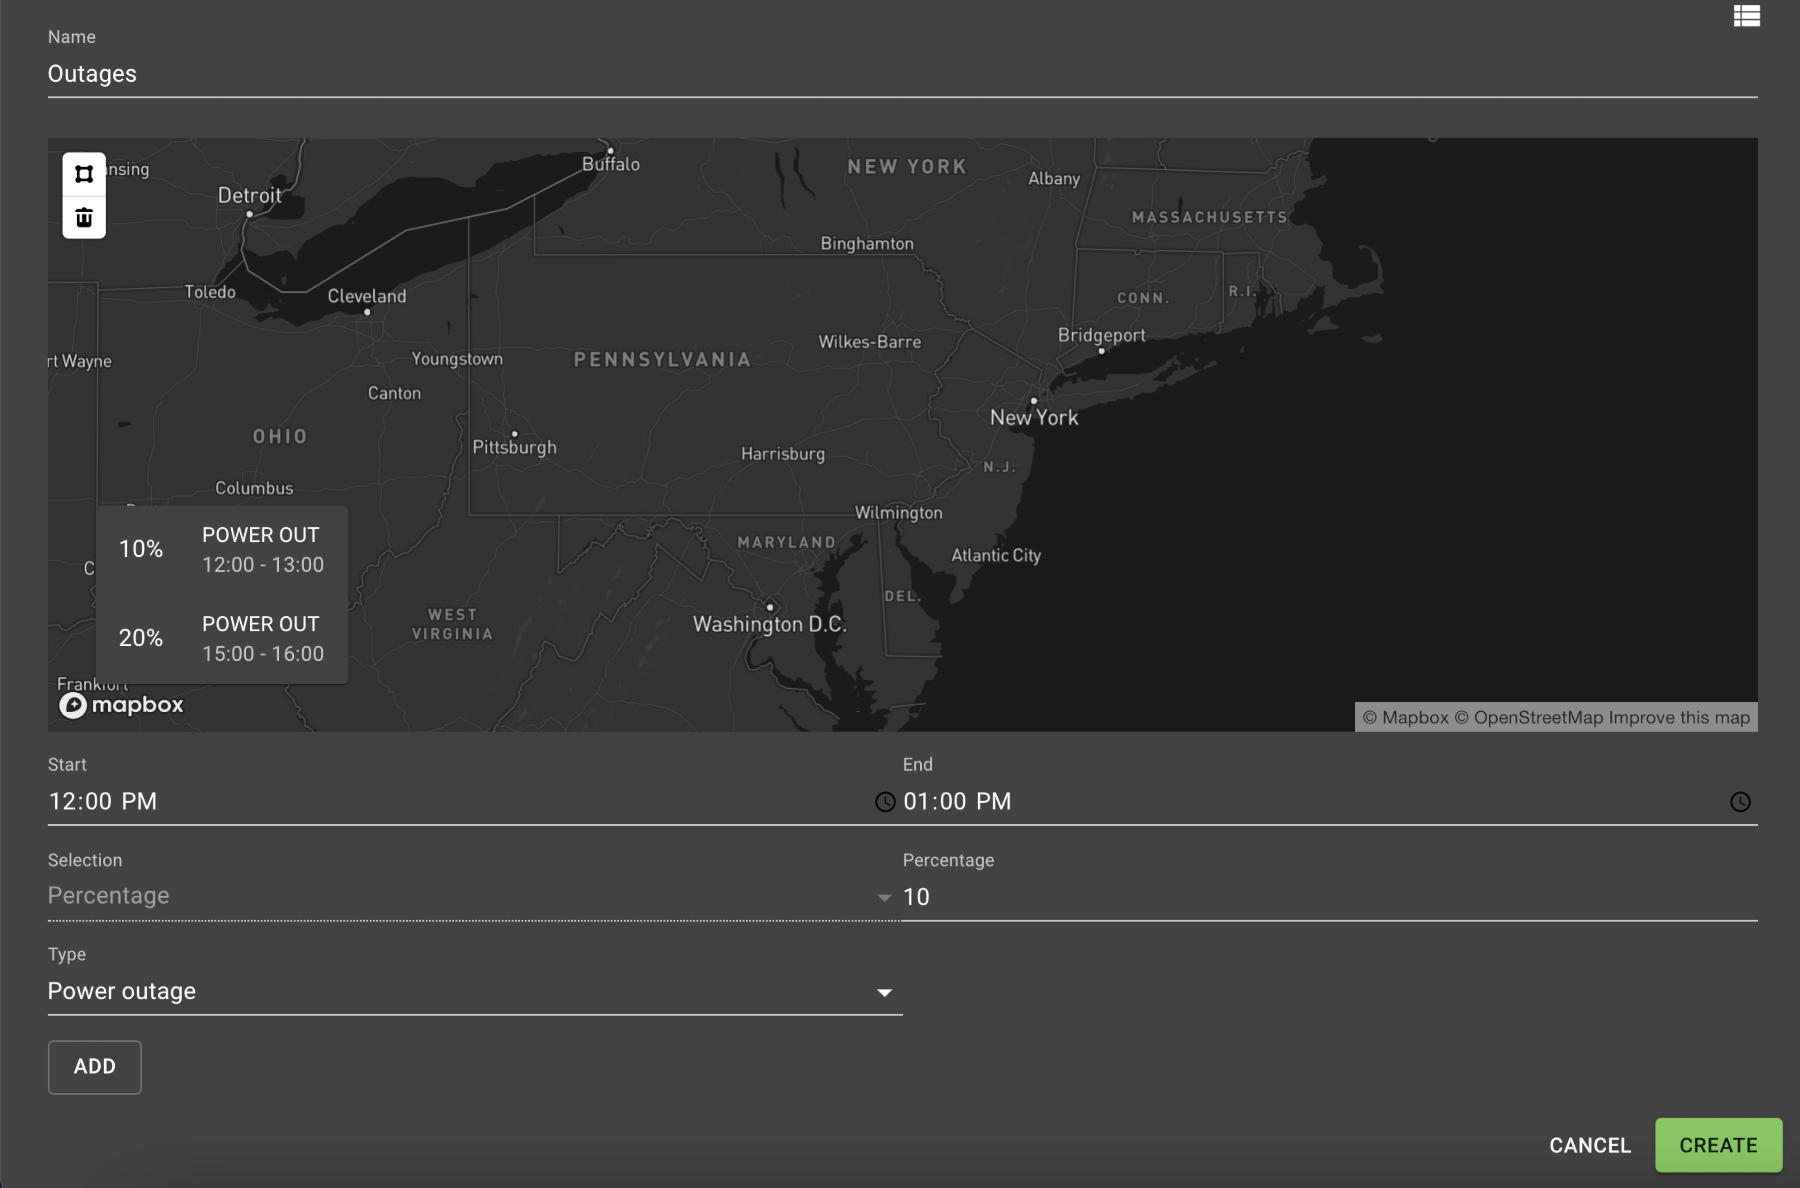
Note the Selection option that defaults to "Percentage". This value sets what percentage of the usage points will be affected by the event.
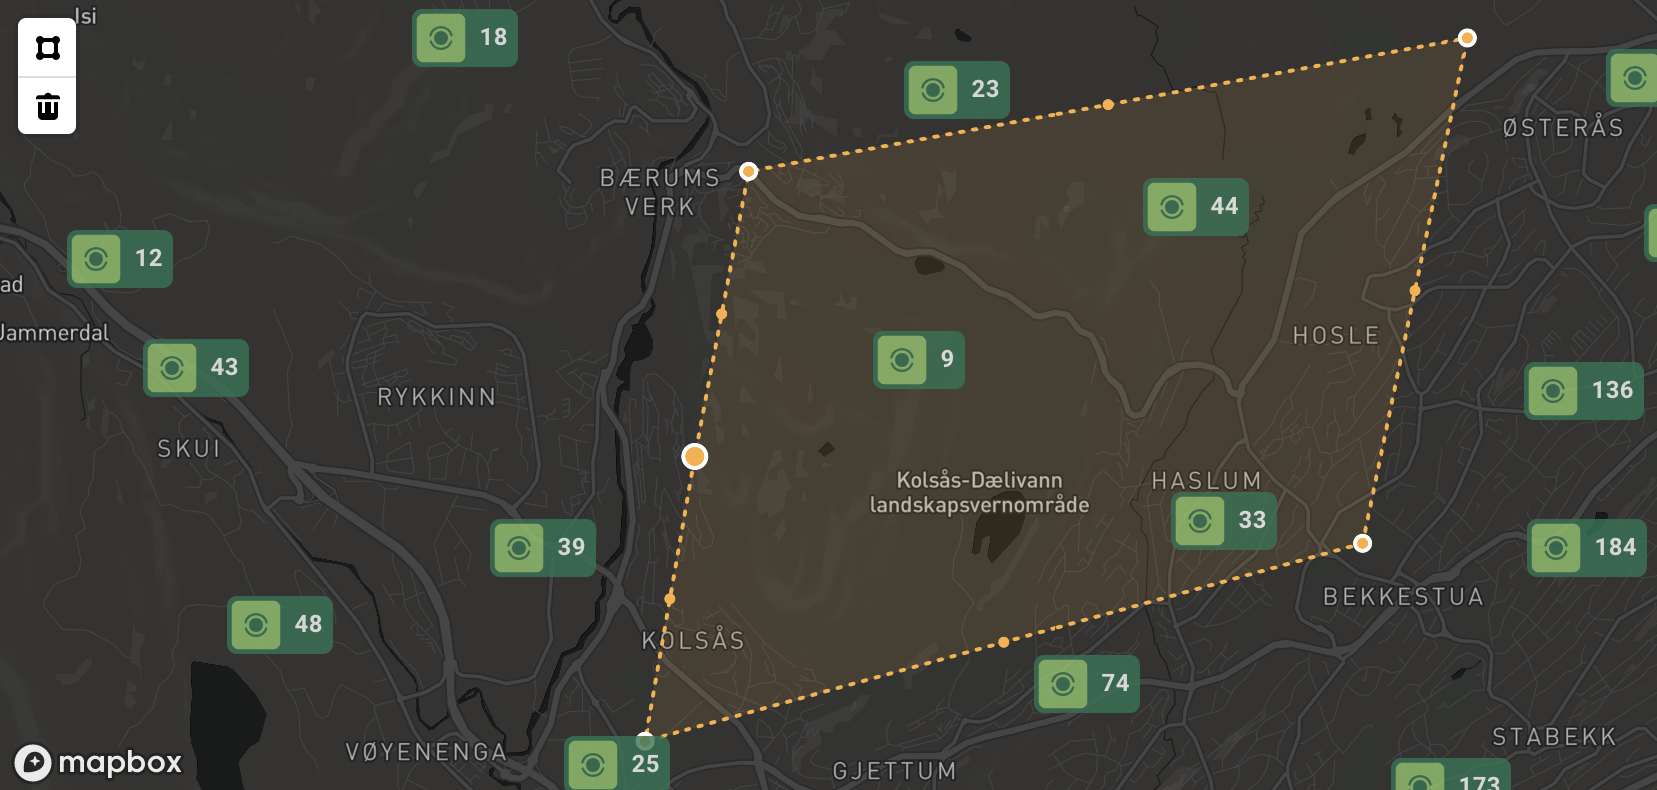
Alternatively, you can draw a perimeter around the usage points that should be part of the event. Select the polygon button ( ![]() ) in the top-left corner of the map, then click on different areas of the map to define the boundaries. The following image demonstrates what you should see:
) in the top-left corner of the map, then click on different areas of the map to define the boundaries. The following image demonstrates what you should see:
Lastly, select the Add button to add the current event to the scenario. Multiple events can be added before finalizing the scenario by selecting Create.