Flow Details
Flows can be accessed by selecting their names as they appear in the Heartbeat Overview or by searching for them in the Flows page.
Overview
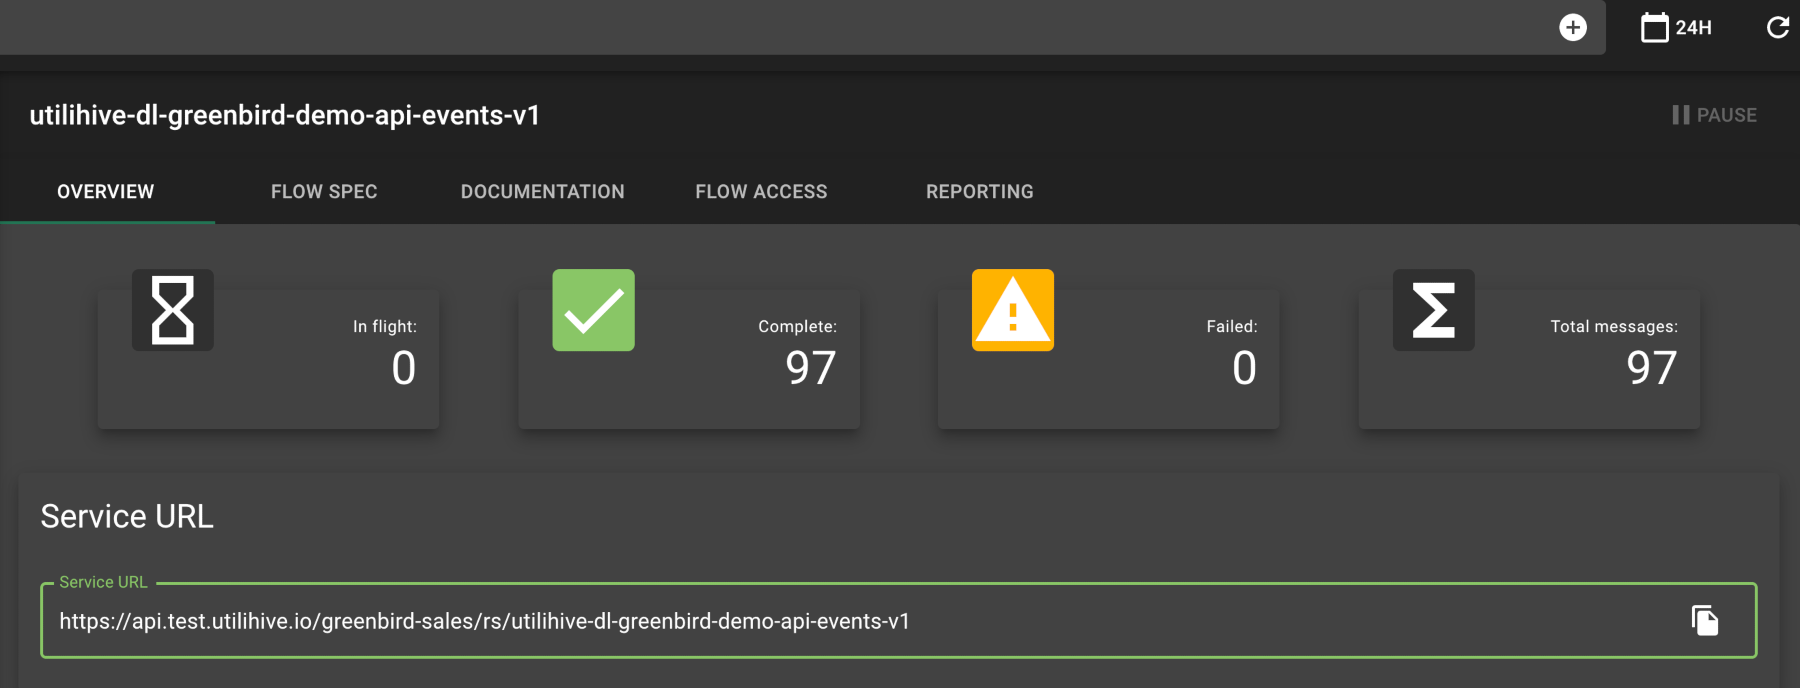
Each flow has its own overview that, like the main Heartbeat Overview, provides a quick glance on the state of messages in the flow. The following image demonstrates the overview for a REST API flow:
|
The time range set by the top-right calendar button ( |
Flow Spec
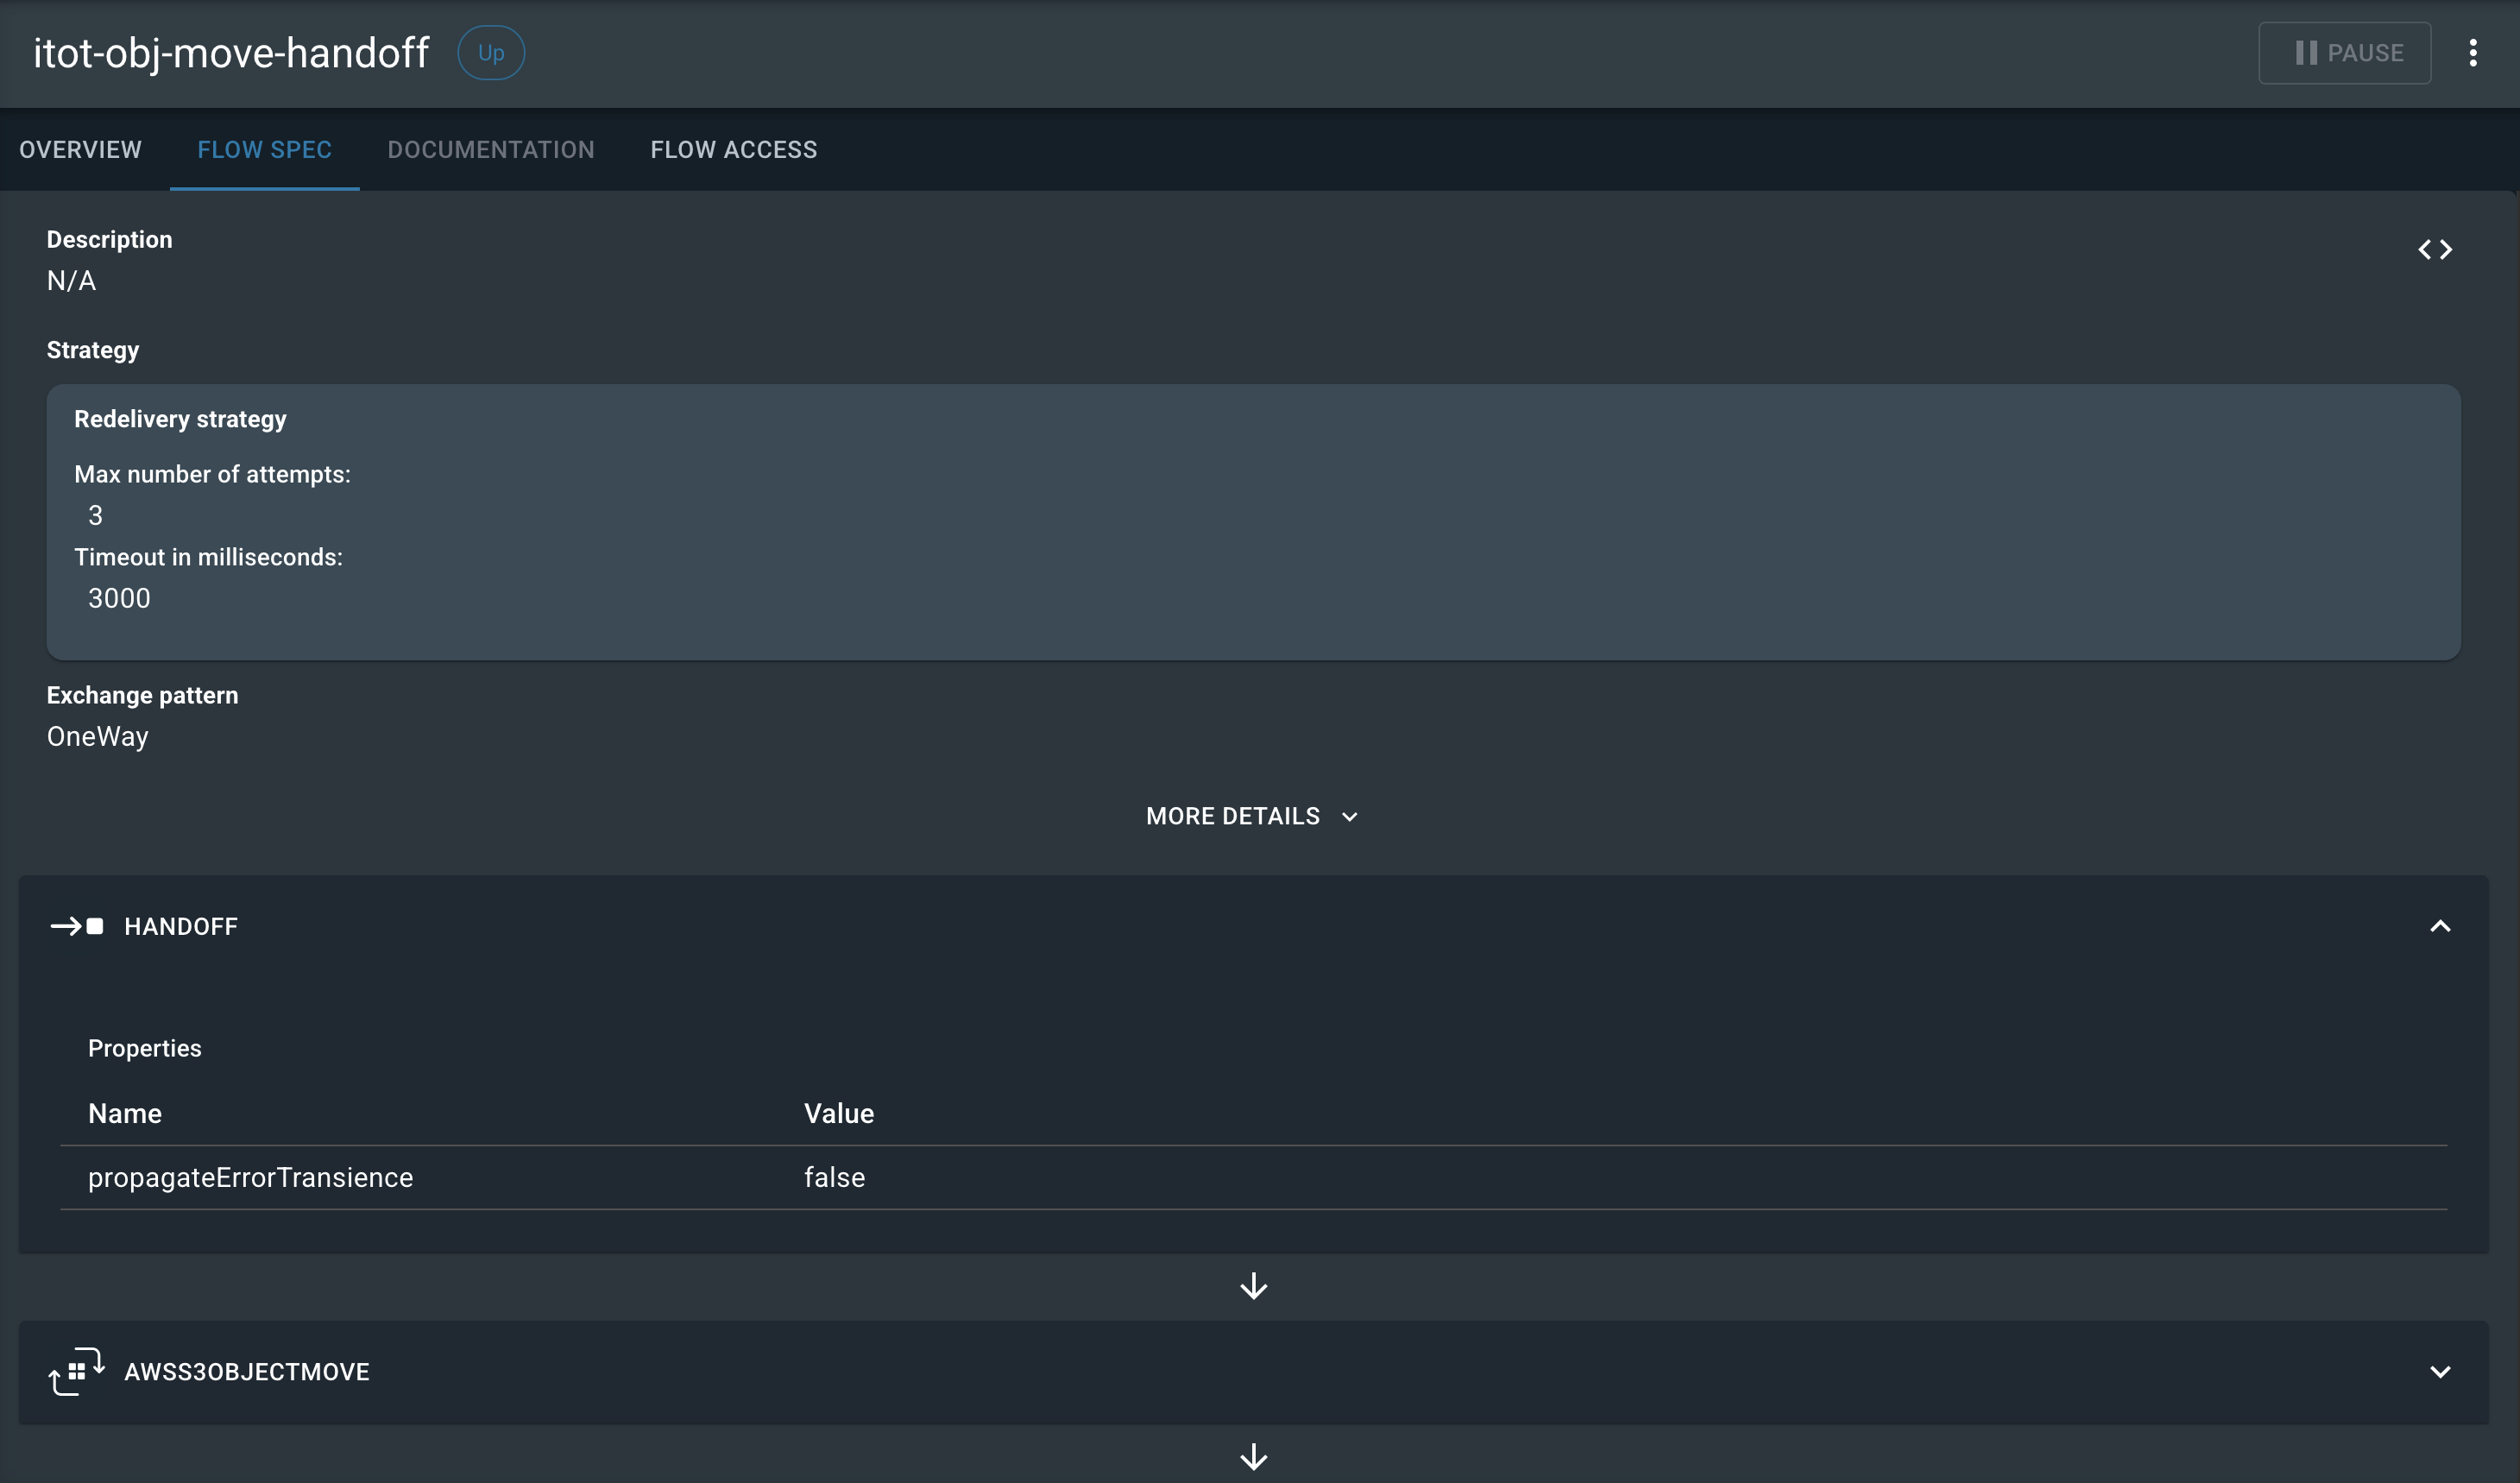
Selecting the Flow Spec tab provides a few different options for reviewing a flow’s specification. The following button on the right side of the page will change the view accordingly:
| Button | Description |
|---|---|
|
A low-code view of the object-oriented flow spec with expandable and collapsible nodes. |
Documentation
If the flow is a REST API, its OpenAPI resource will be converted into a testable UI, thus enabling the Documentation tab. The following image demonstrates with this tab looks like:
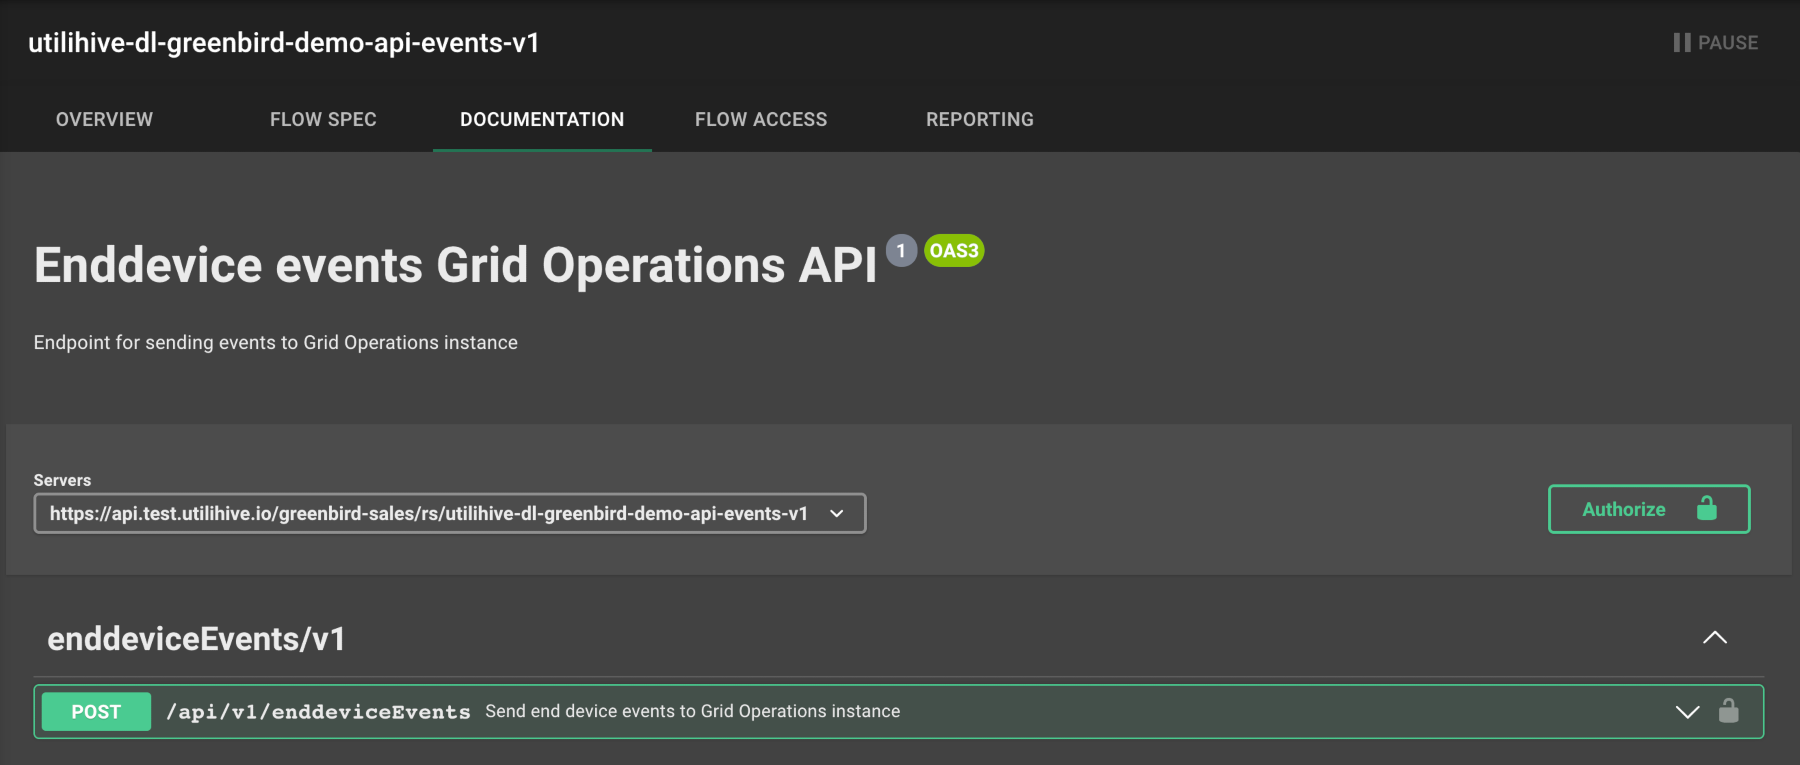
This is an implementation of Swagger UI where you can review and make requests to REST endpoints in the browser. Expanding one of the HTTP request types (e.g., POST) will display the parameters, expected request body, and possible responses for that request, as the following image shows:
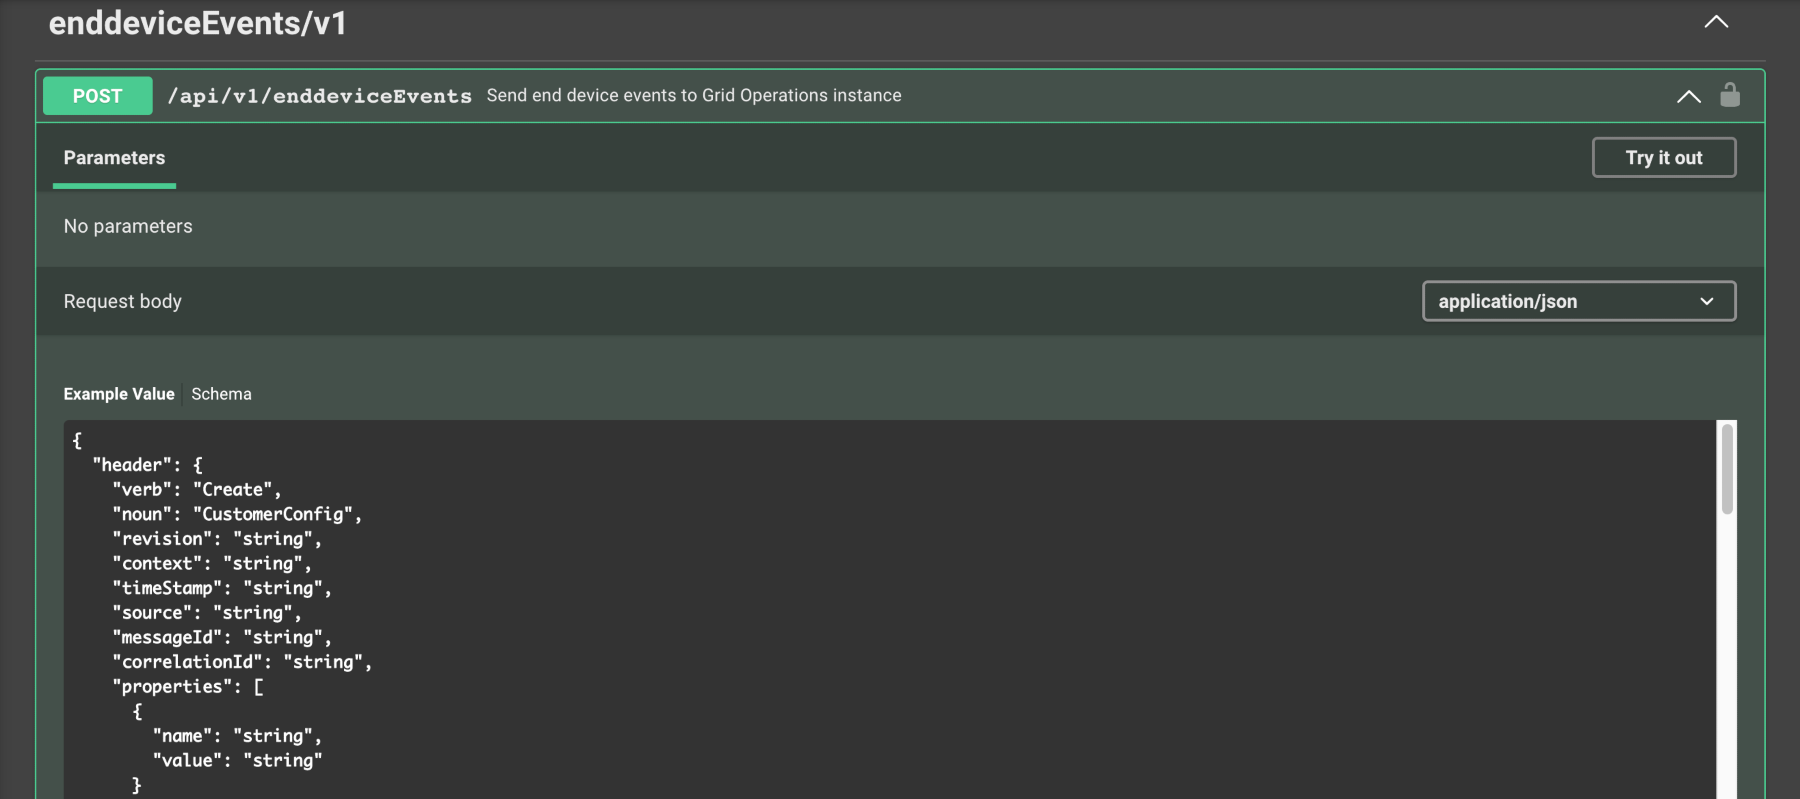
Select the "Try it out" button and then the Execute button to perform an actual request to that particular endpoint. The following image demonstrates executing a POST request that returned a 401 status:
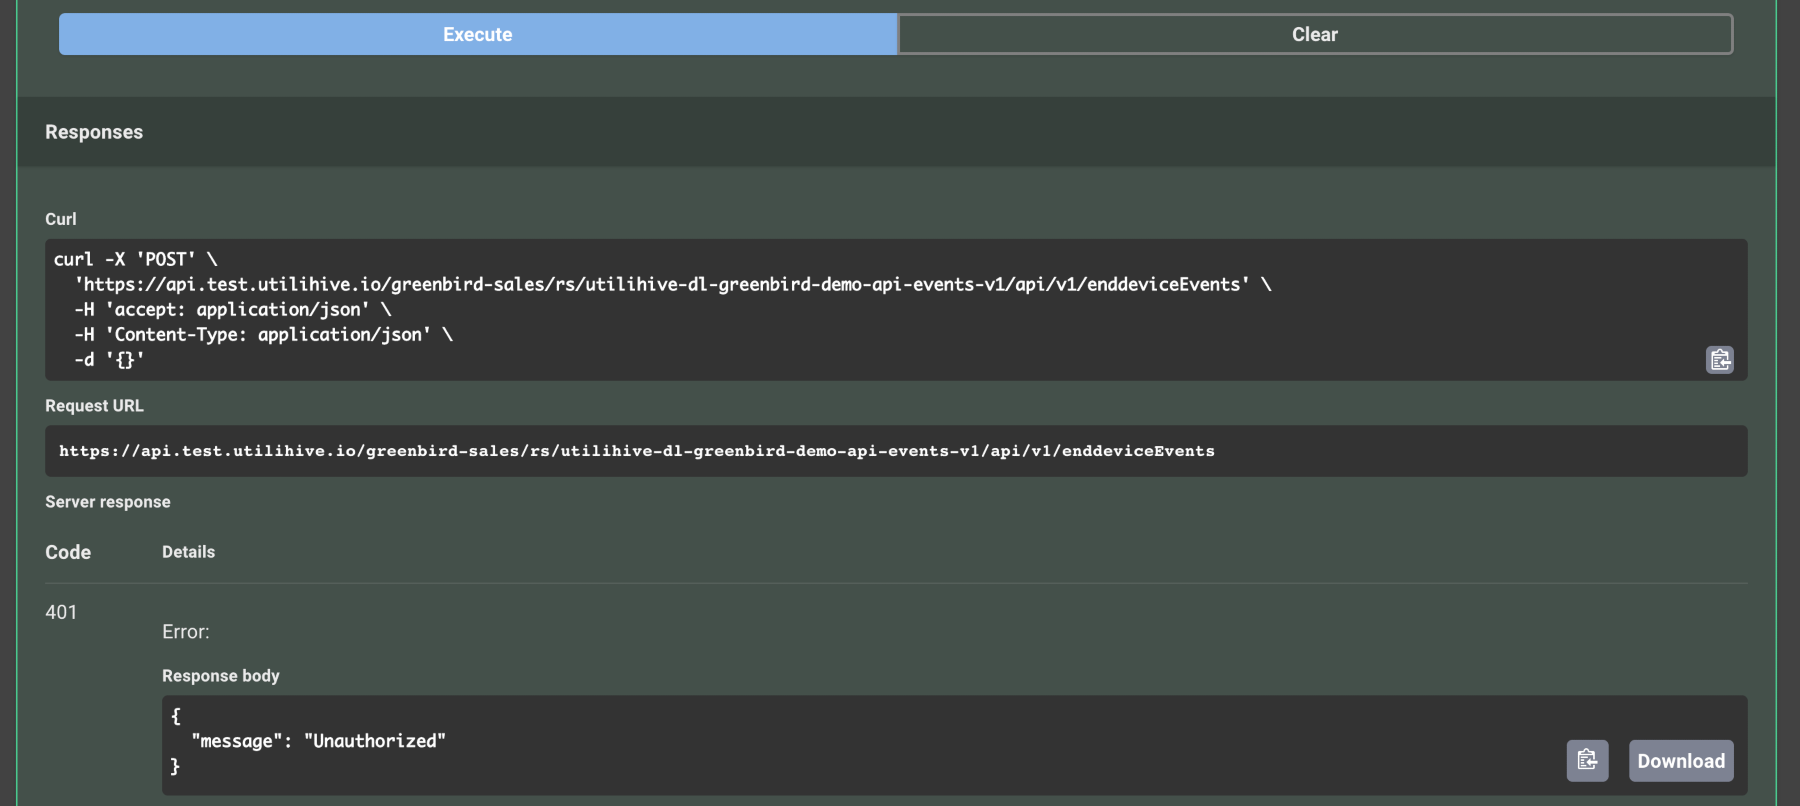
| The "Try it out" feature will only work if you have added authorized credentials. To do so, select the Authorize button at the top of the page and add a valid username and password. See the Flow Access section for more information on generating these credentials. |