Reporting
There are two places in the Utilihive Console that provide reporting: the left-hand navigation menu for global reporting and within an individual flow’s details for more granular reporting.
Global Reporting
The main reporting page provides a bar graph of how many messages have been received each day. If the time range is set to 24 hours or less, then the breakdown is hour-by-hour. The following image displays the message counts over a 30-day period:
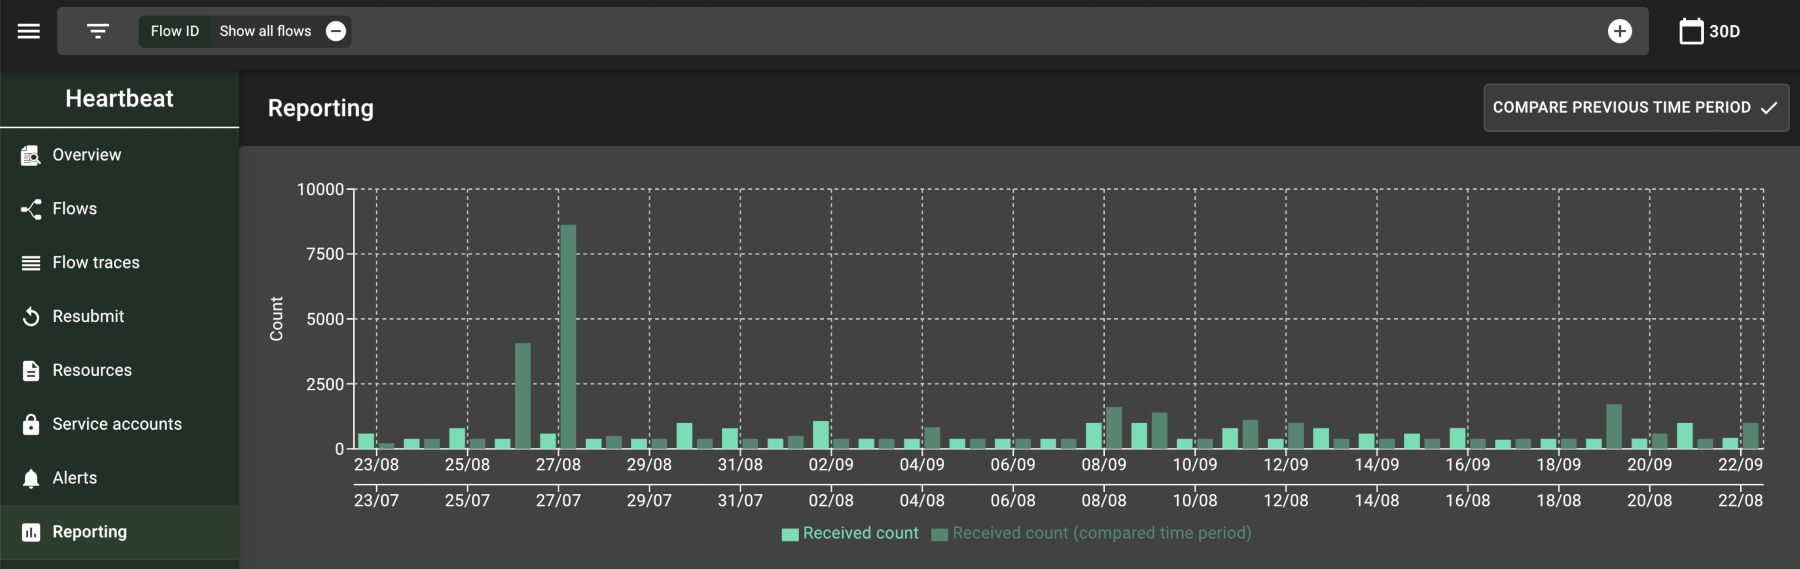
Selecting the "Compare Previous Time Period" button will add a second set of bars to the graph. Note that the previous time period is based off of the current time range. For instance, a 30-day period will be compared to the previous month, seven days to the previous week, etc.
This data can also be downloaded as a CSV file via the download button ( ![]() ). The file will contain only the columns and rows that are currently visible on the page. By default, the CSV file would look like the following:
). The file will contain only the columns and rows that are currently visible on the page. By default, the CSV file would look like the following:
"Current time period","Received count"
"2021-09-21 T 00:00","993"
"2021-09-22 T 00:00","595"
"2021-09-23 T 00:00","386"
"2021-09-24 T 00:00","392"
"2021-09-25 T 00:00","384"
"2021-09-26 T 00:00","384"
"2021-09-27 T 00:00","1097"
"2021-09-28 T 00:00","1190"
Flow-Level Reporting
Individual flows have their own reporting tab, which looks like the following image:
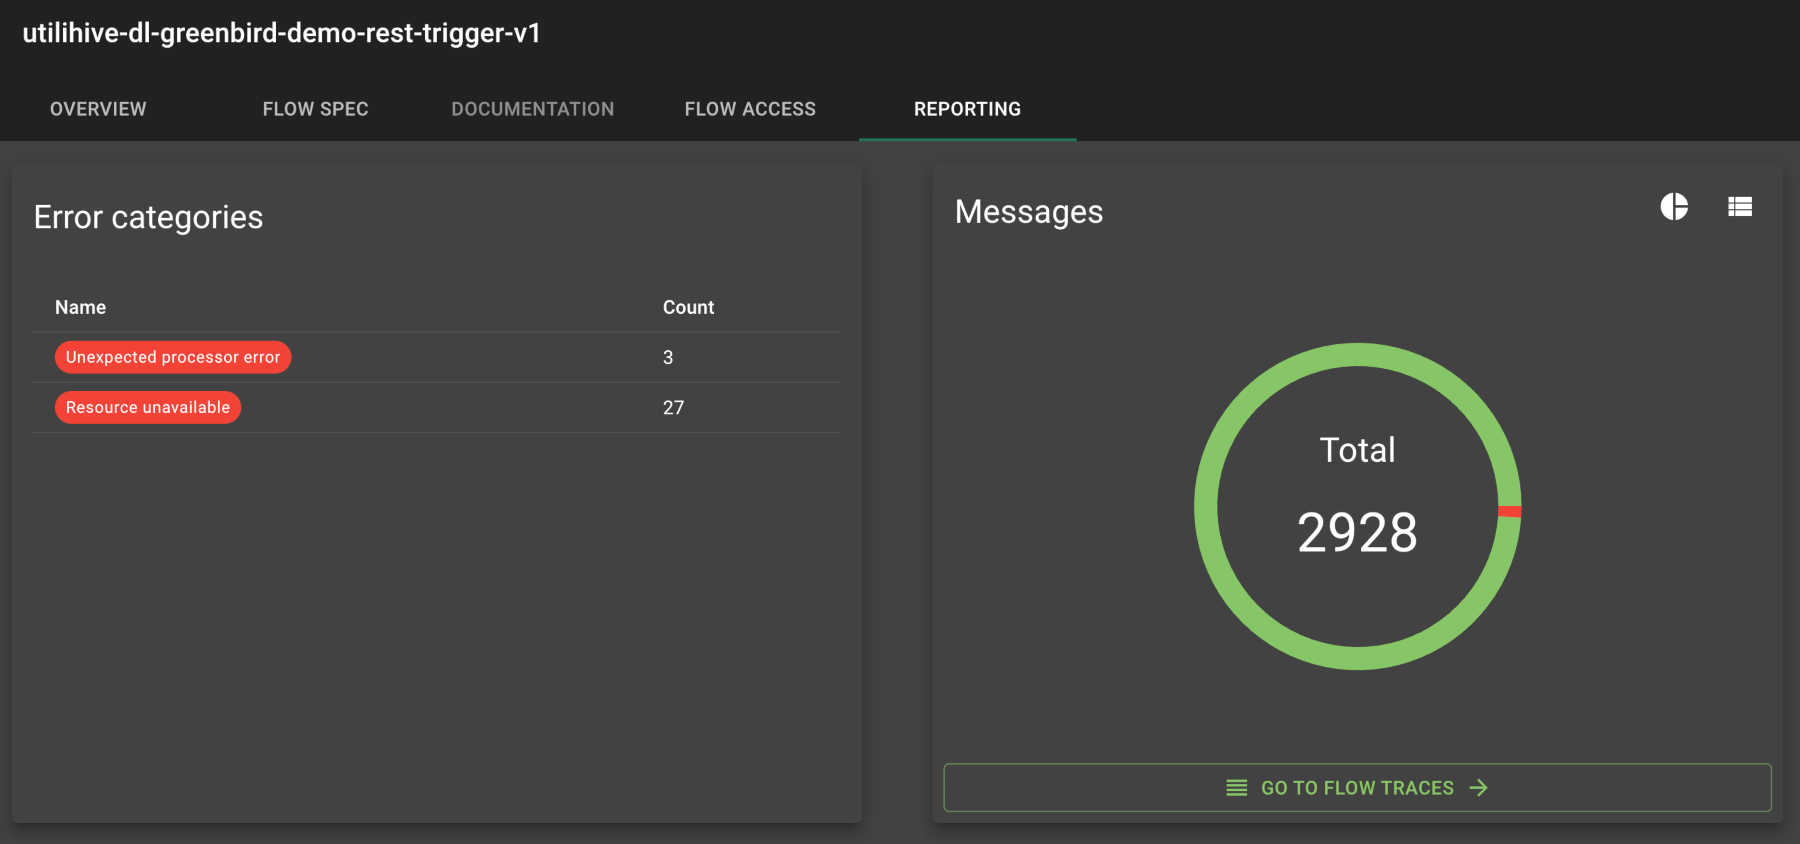
The difference between this view and the global reporting view is the more granular breakdown in error types. These error categories also double as quick links to the flow traces that will automatically apply the necessary filters.
| Flow-level reports are not available in CVS format, though filtered flow traces can be downloaded as such. |