Utilihive Console
The Utilihive Console is an in-browser visual dashboard that facilitates the management and use of different Utilihive services. Its features depend on which modules are enabled for your instance but can include the following:
Heartbeat
The Heartbeat interface is part of the flow-server and is used to manage and monitor deployed flows. At a glance, Heartbeat tracks the number of in-flight, processed, and failed messages, as the following image demonstrates:
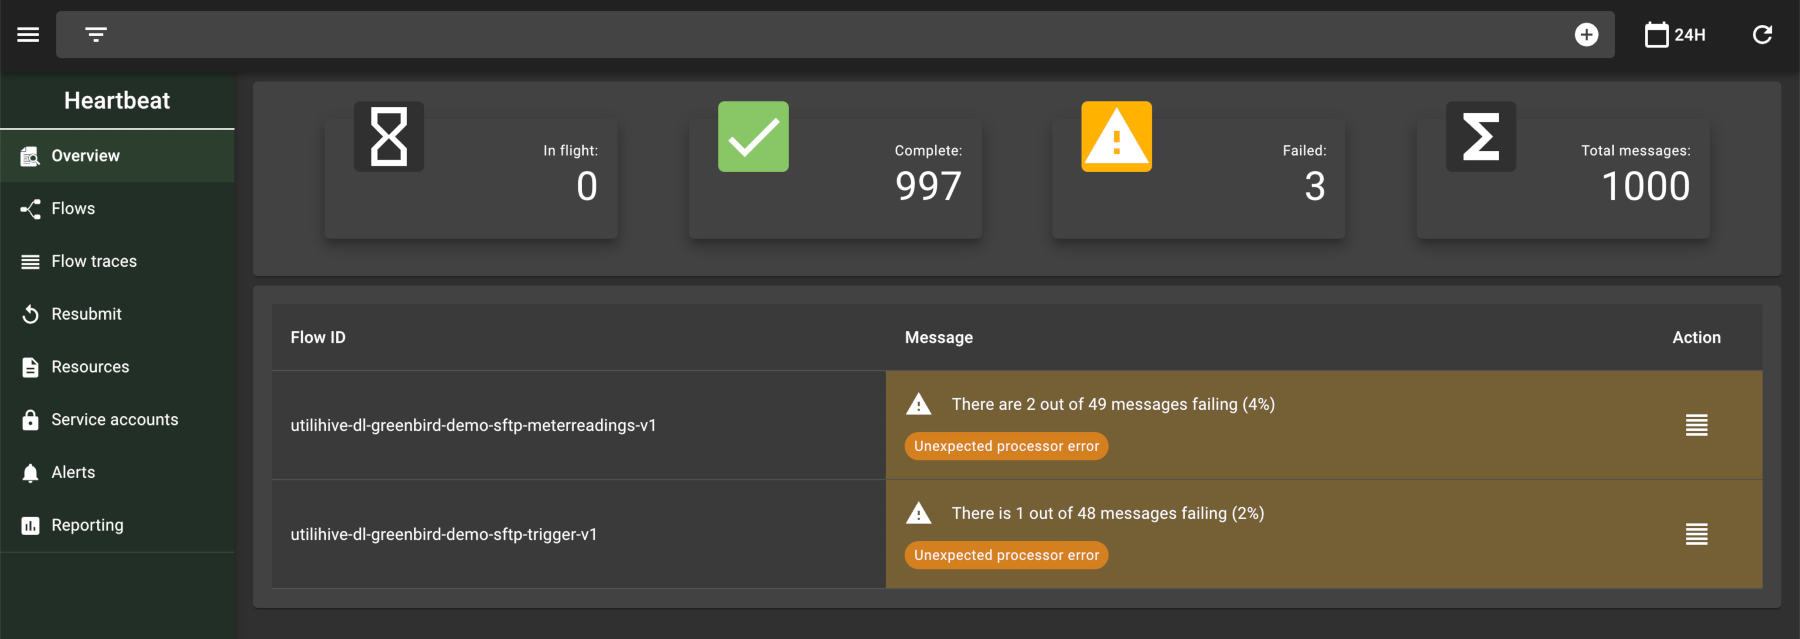
This data can then be used to generate reports based on a given time period. Heartbeat also allows users to trace messages passing through a flow and manage the credentials that can access a flow’s endpoints. The following image highlights the options available at the individual flow level:

For more information on how to use Heartbeat, check out the documentation on Management and Monitoring.
Datalake
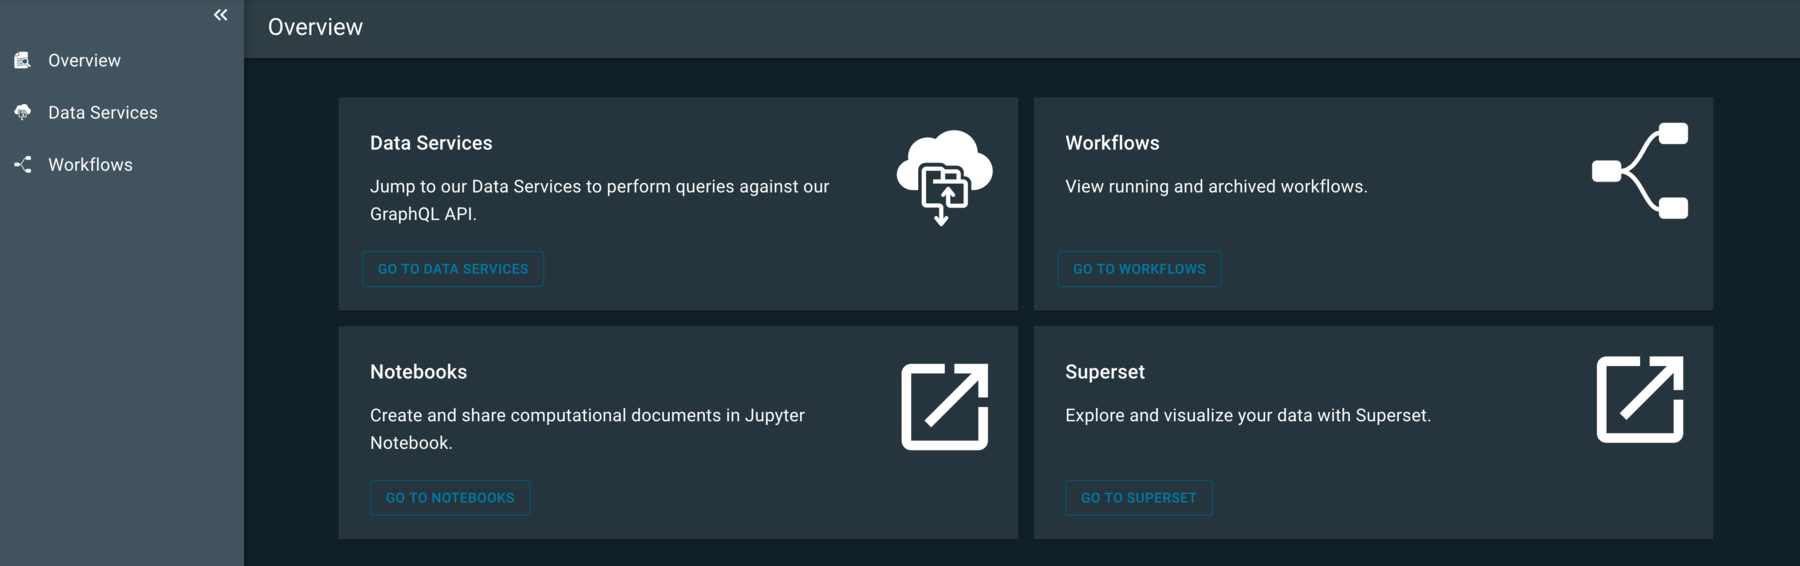
In the Utilihive Console, Datalake refers to a set of tools that provide different ways to interact with the underlying data lake service. The following image shows an overview of these tools:
Ghostwriter
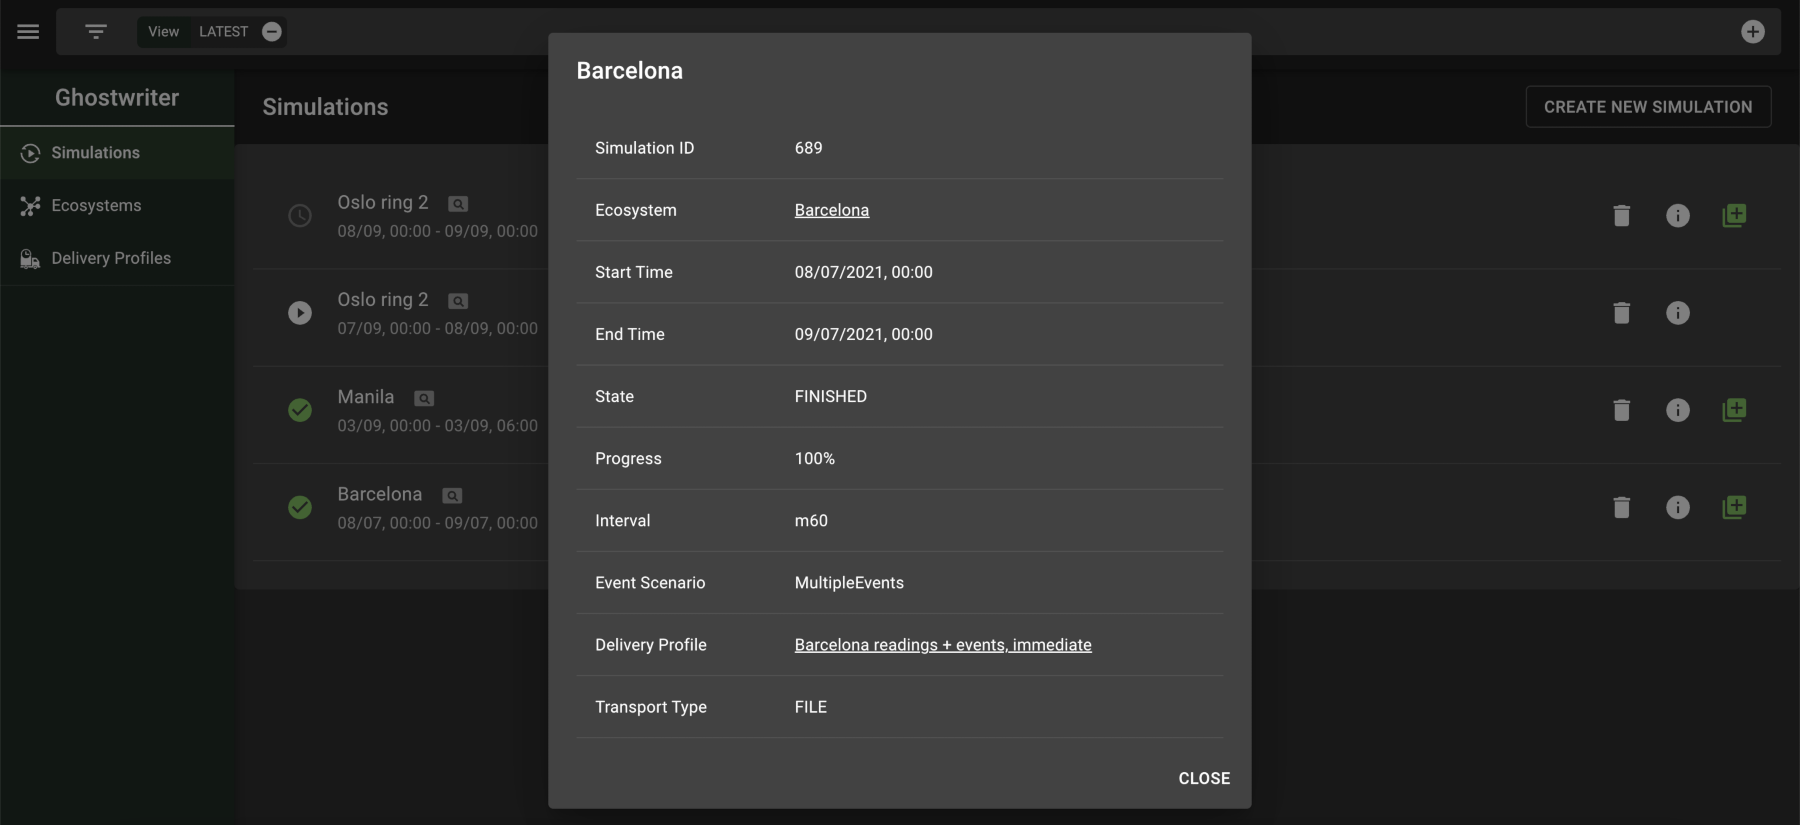
Ghostwriter provides a way to simulate meter readings and events over a set period of time, which are then delivered to a desired flow. The following image displays the results of a finished simulation:
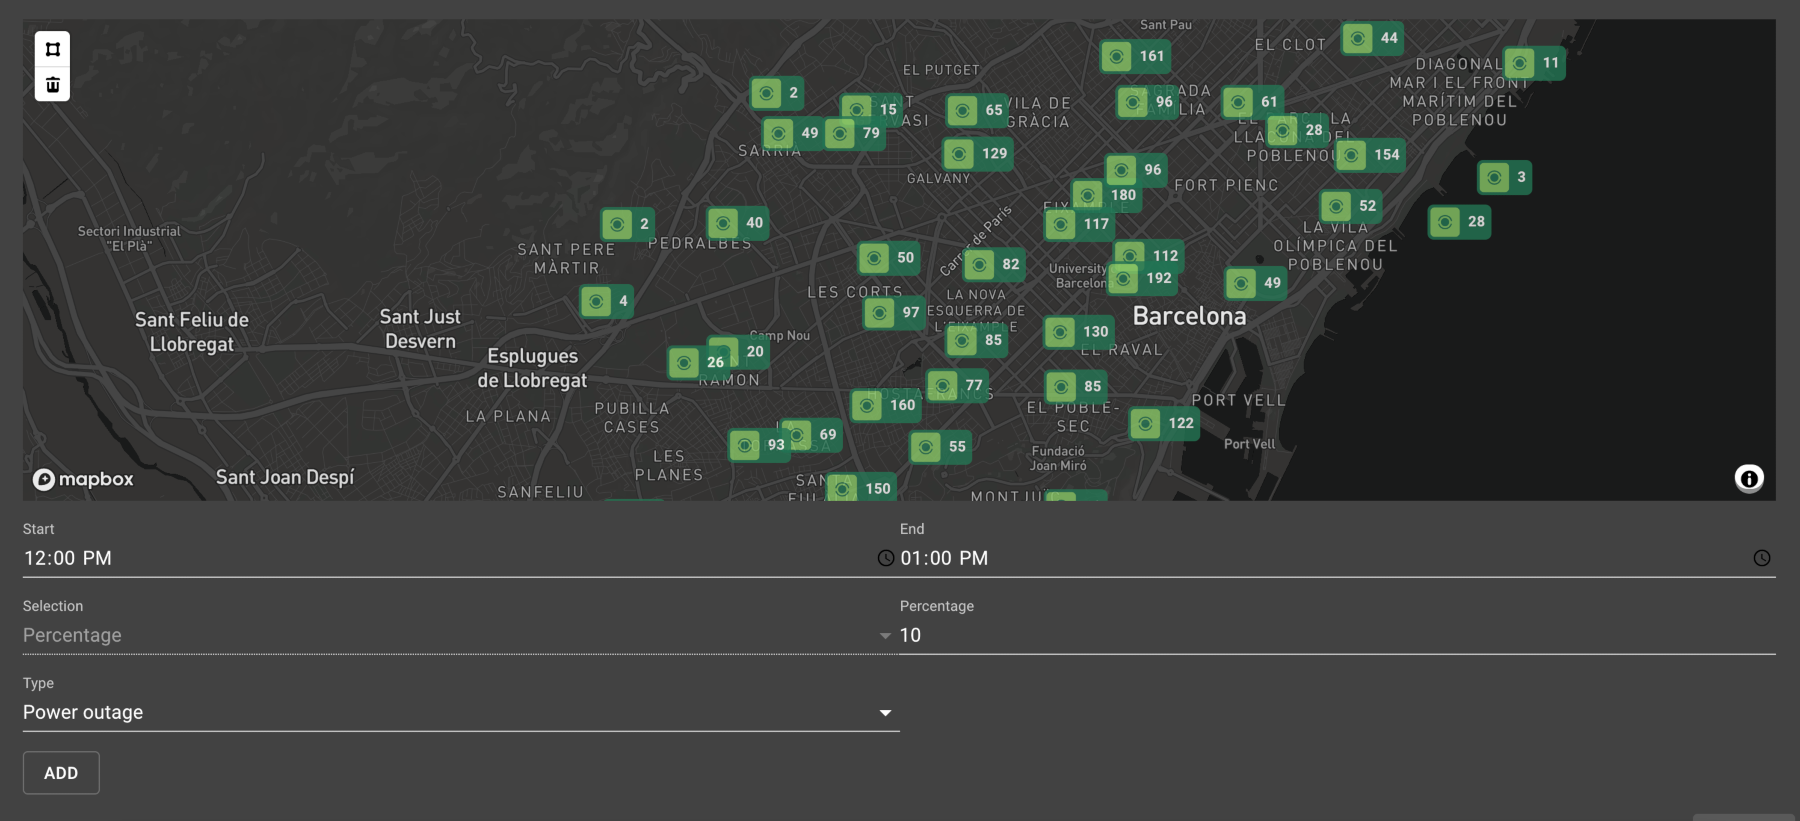
Simulations can be set up to take place in certain timezones and trigger special events like a power outage or corrupt reading. The following image demonstrates creating one of these events:
For more information on how to use Ghostwriter, start with the documentation on Simulations.