Connect Flow Source Streaming Dashboard
The Connect Flow Source Streaming Grafana dashboard shows the current stream related metrics (Opened, Successful, Failed, and Rejected) and the progress of byte-streaming flows.
To access the Connect Flow Source Streaming dashboard, open https://admin.YOUR_DOMAIN/monitoring/grafana/d/connect-flow-source-streaming, or search for Connect Flow Source Streaming in the Foundation Grafana dashboard list.
Use the filters to select an owner or streaming flows by ID.
At the top of the dashboard:
-
Data source: The
victoria-metricsdata source, by default. -
Owner: The owner or organization responsible for the flow, such as
gridos. -
Flows: The flows currently monitored on the dashboard.
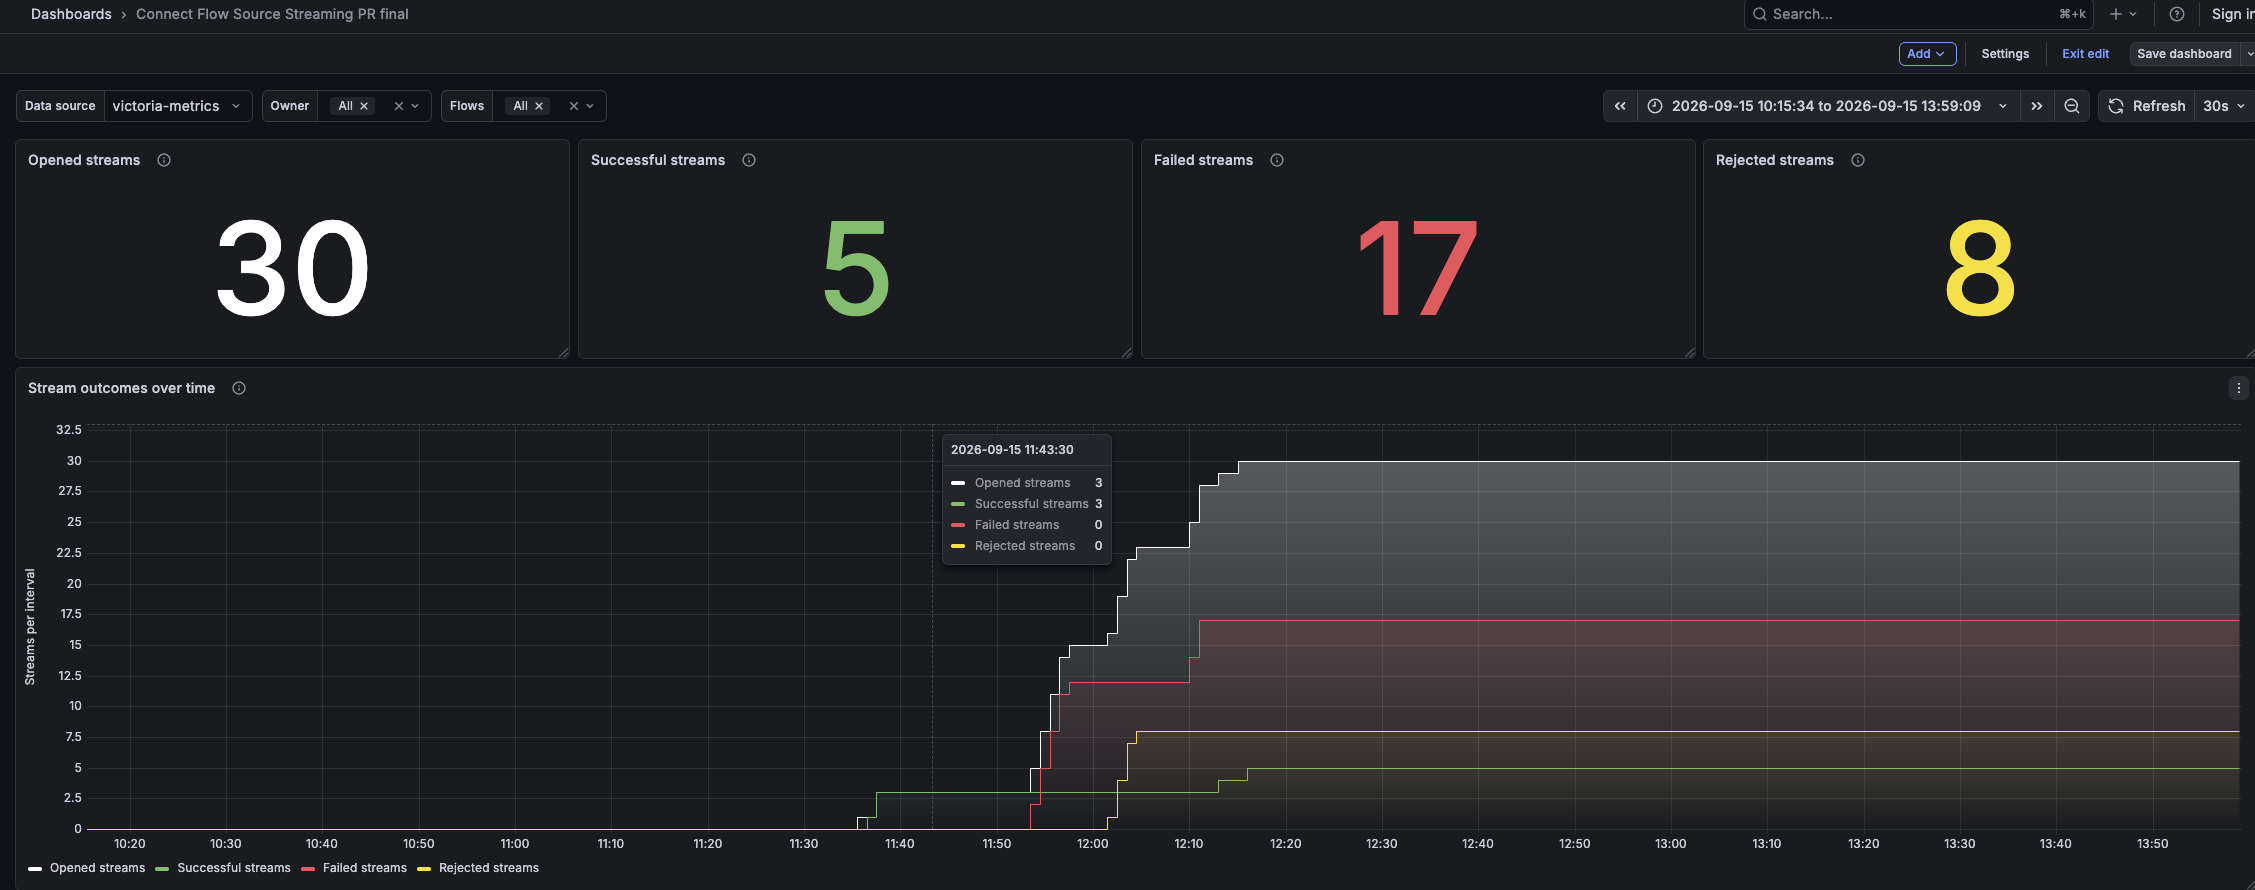
The dashboard is organized into two sections, showing a total of five panels:
Opened streams
The Opened streams panel shows streams that have been opened. This panel identifies the streams that are currently in progress and may require attention if they remain open for an extended period. When there is no ongoing streaming operation, the value for Opened panel should be the total of Successful, Rejected, and Failed streams.
Successful streams
The Successful streams panel shows streams that have been completed successfully.
Failed streams
The Failed streams panel shows streams that have encountered errors and did not complete successfully.