Product Health Dashboard
The Product Health Grafana dashboard provides a single, aggregated view of Connect’s overall health by combining the status of all Connect services and dependencies into one health status. If the overall status is degraded or unhealthy, check the panels under Health Diagnostics to identify which component is responsible.
To access the Product Health dashboard, open https://admin.YOUR_DOMAIN/monitoring/grafana/d/gridos-connect-product-health, or search for GridOS Connect Product Health Dashboard in Foundation Grafana’s dashboard list.
At the top of the dashboard:
-
Source: the Prometheus datasource (default).
-
Namespace: the namespace where Connect is installed, defaults to
foundation-env-default. You must change this if Connect is installed in a different namespace.
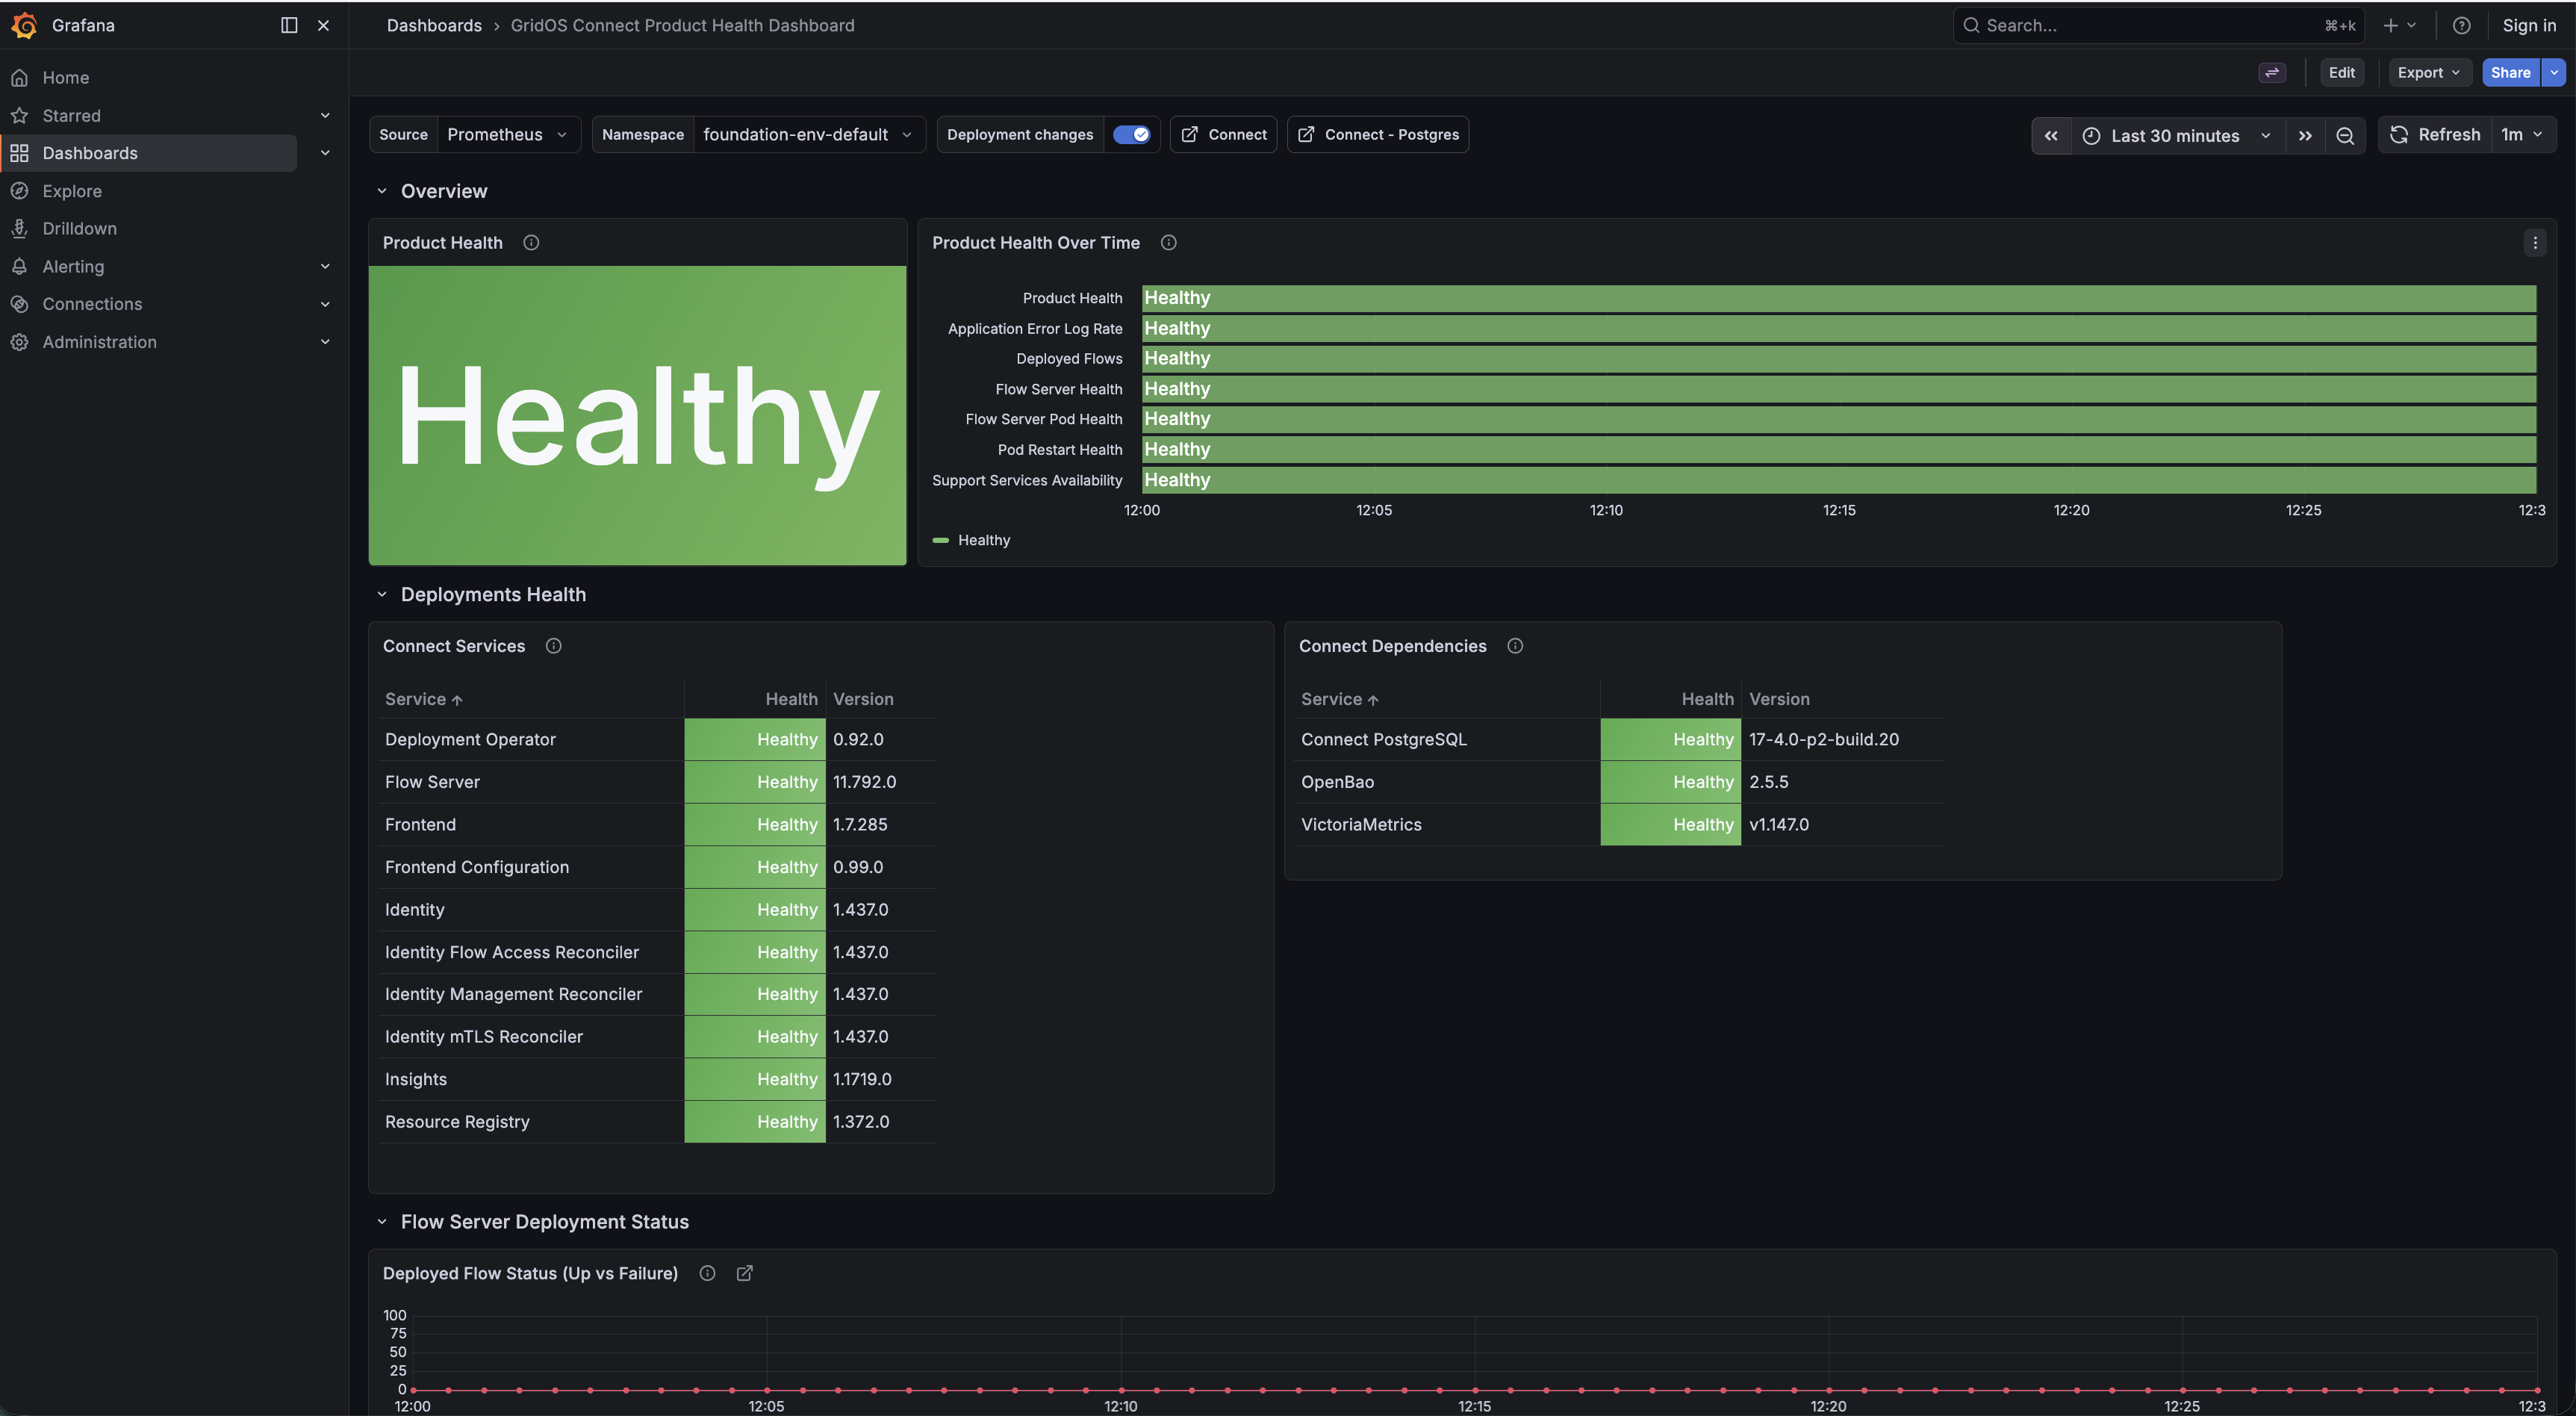
The following image shows the dashboard when Connect is operating normally — all services and dependencies are Healthy and no conditions are active.
If the overall status is Degraded or Unhealthy, it indicates that at least one condition is active at Degraded severity. Connect is still processing messages, but attention is required. Use the Health Diagnostics row to identify the root cause.
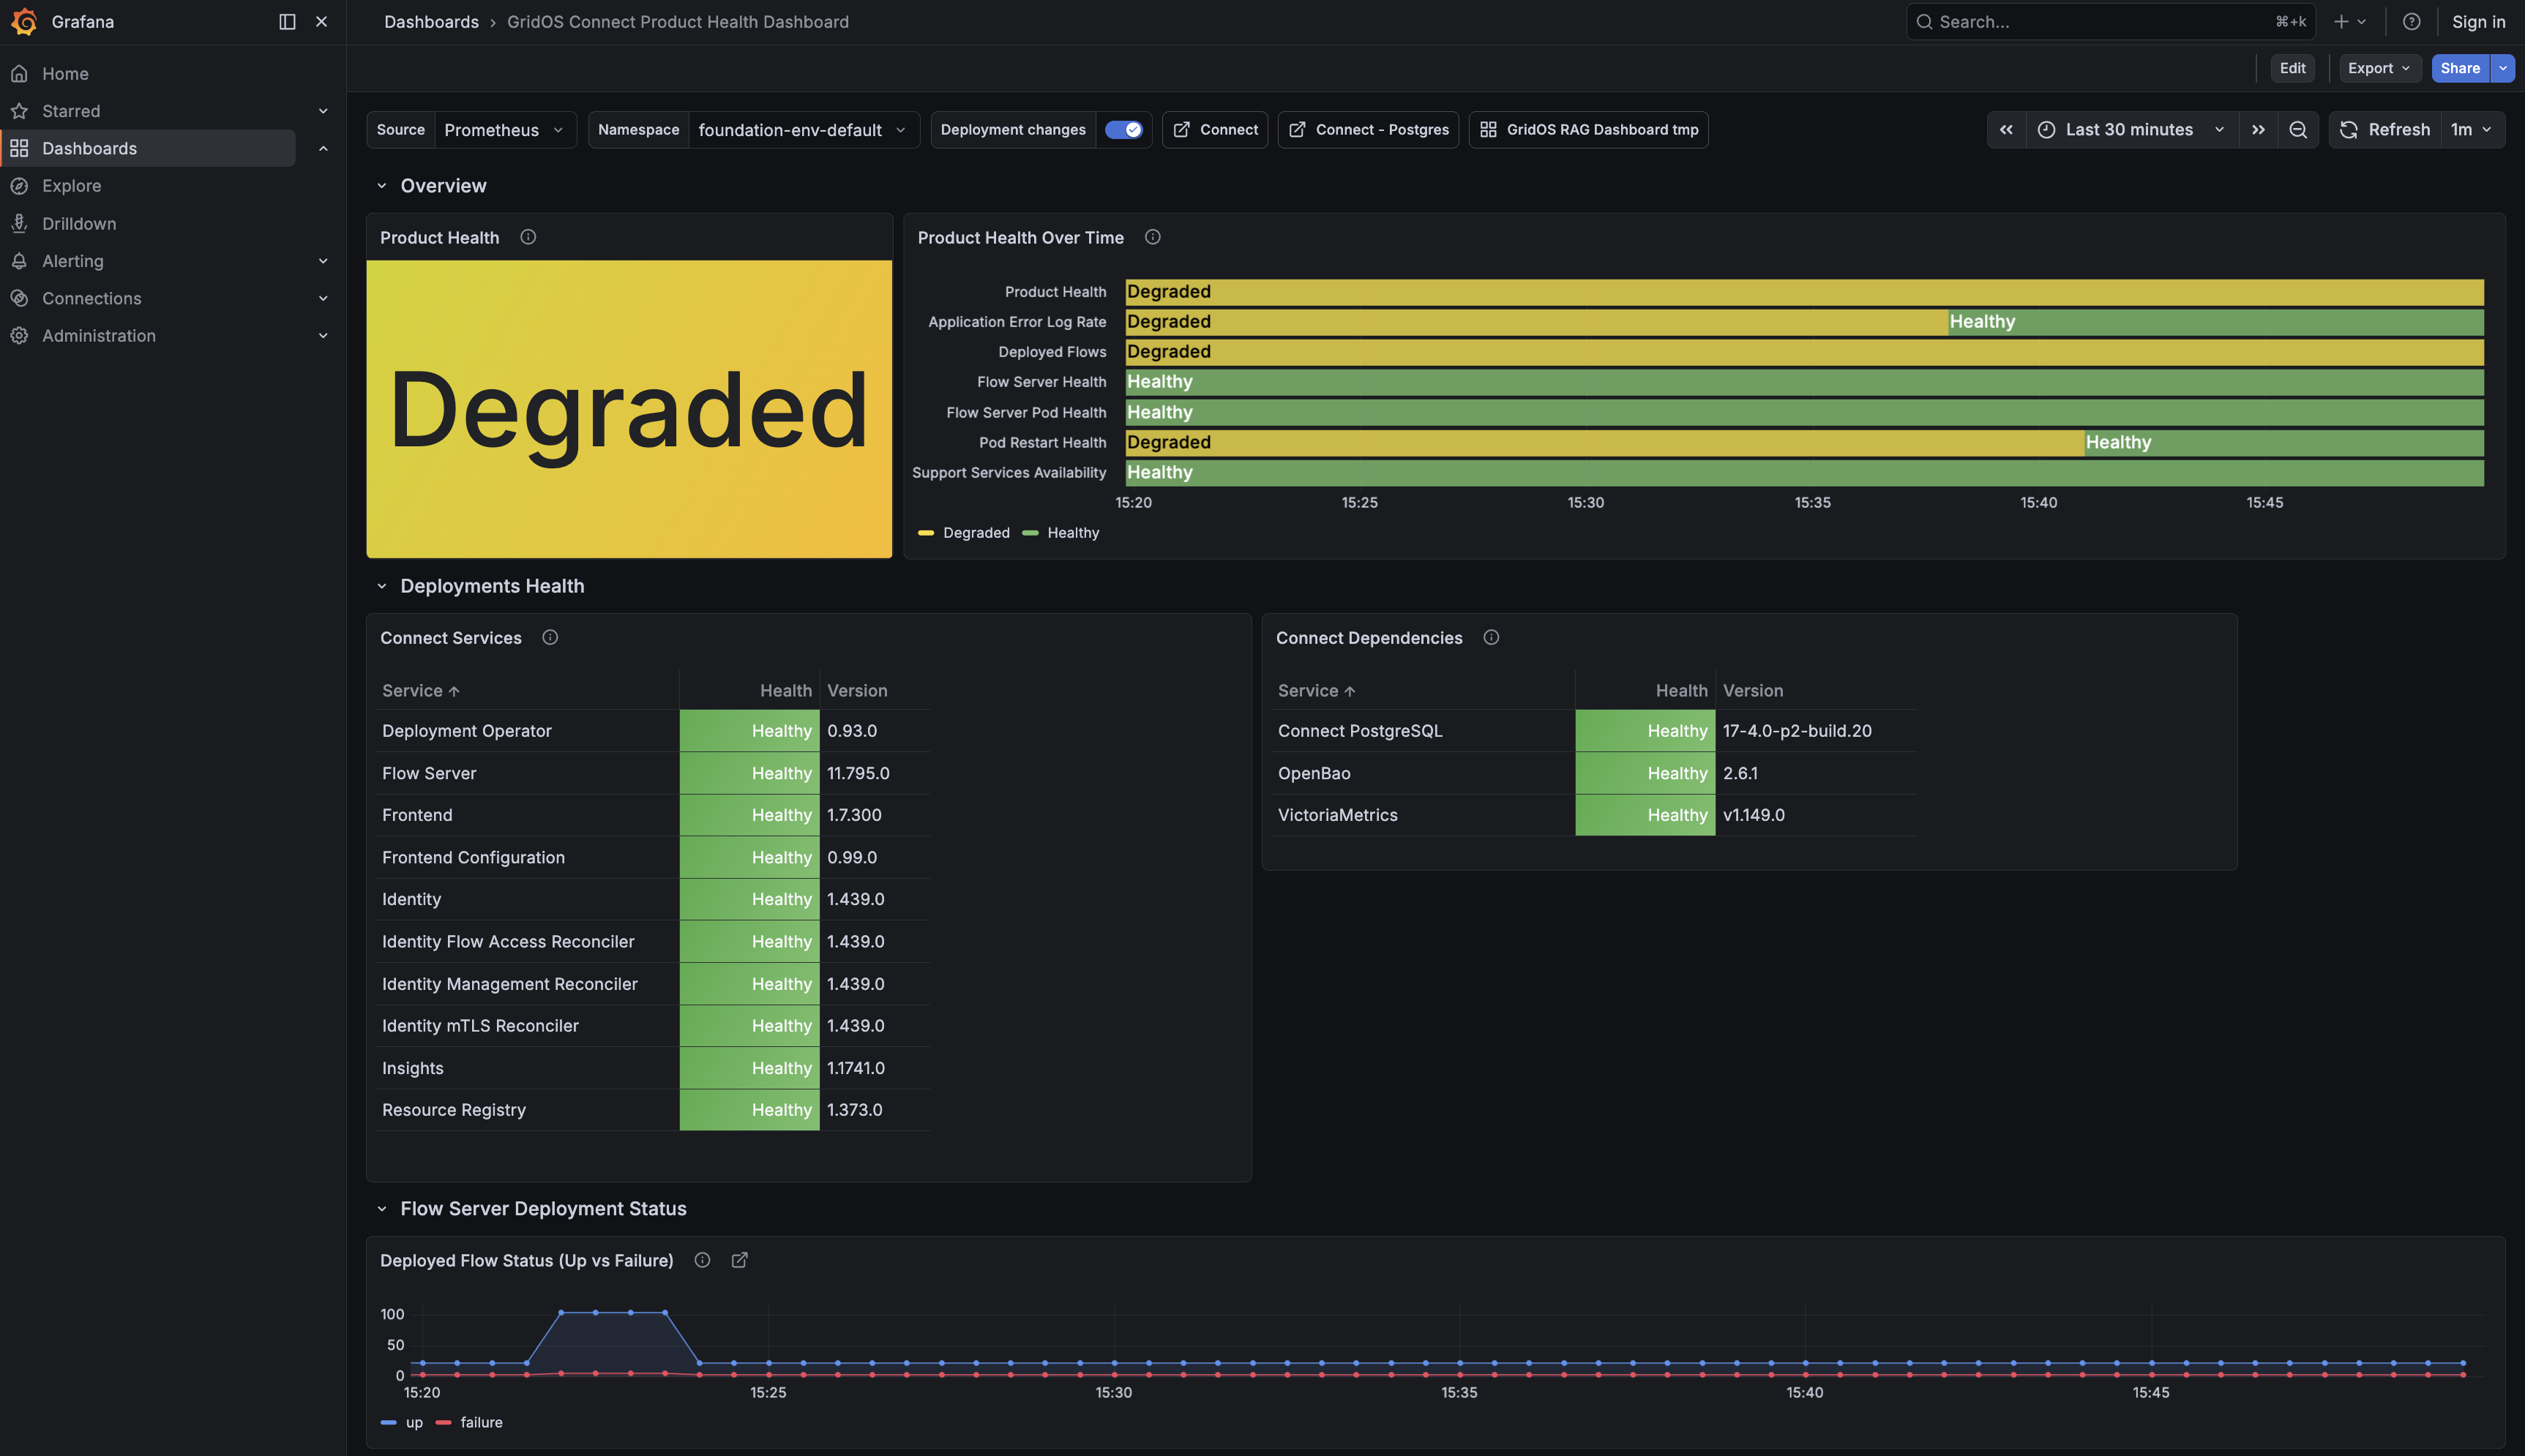
The dashboard is organized into four sections, each shown as a row of panels:
Overview
The Overview row shows the current health state and a health timeline for the selected time range. It contains two panels:
Product Health
This state panel shows the current overall Connect health as Healthy, Degraded, or Unhealthy.
Both Product Health and Product Health Over Time read the product health metric, which represents the maximum severity across the six conditions listed in the Health Signal Reference table below.
| Value | Label | Color | Meaning |
|---|---|---|---|
0 |
Healthy |
green |
No active health issues. Connect is operating normally. |
1 |
Degraded |
yellow |
At least one condition is active at Degraded severity. Connect is still processing messages, but attention is required. |
2 |
Unhealthy |
red |
At least one condition is active at Unhealthy severity. Connect message processing is significantly impacted. |
| If the panel shows No Data with a grey label, the product health metric is not present. This usually means the PrometheusRule is missing or that Prometheus lost all of its input series. |
Product Health Over Time
This state timeline chart shows how each condition’s health status changes over the selected time range. Each signal in the Health Signal Reference table appears as a separate series.
The Deployment changes toggle (available at the top of the dashboard, enabled by default) shows a vertical dashed line on this panel whenever a Connect Kubernetes Deployment changes. Use it to check whether a health status change correlates with a deployment event, such as a Helm upgrade of the Connect chart.
Health Signal Reference
Each active condition appears as a named signal in the Active Health Issues panel and in the Product Health Over Time chart legend. Each condition is Healthy unless the trigger described below is active; the following table describes each signal, its severity, and the exact condition that raises it to Degraded or Unhealthy.
These conditions drive the Product Health, Product Health Over Time, and Active Health Issues panels. The highest active severity determines the overall result.
| Condition | Severity | Fires when |
|---|---|---|
Flow Server Health |
Unhealthy |
Flow Server has zero ready replicas, or the Kubernetes deployment is missing entirely. |
Flow Server Pod Health |
Degraded or Unhealthy |
Degraded when Flow Server has fewer ready replicas than desired, but at least one pod is still ready. Unhealthy when any Flow Server pod is in |
Deployed Flows |
Degraded or Unhealthy |
Degraded when at least one flow deployment is failing. Unhealthy when the flow deployment failure ratio exceeds the configured threshold. Only evaluated when flow deployment metric collection is enabled; if disabled, this condition is not shown in any panel. |
Support Services Availability |
Degraded |
Any Connect service (other than Flow Server) or Connect dependency has fewer ready replicas than desired, is scaled to zero, or is missing entirely. If Connect uses an external PostgreSQL instead of the in-cluster one (see Connect - External PostgreSQL), the in-cluster PostgreSQL is expected to be absent and does not affect this condition. |
Pod Restart Health |
Degraded |
Any Connect service or Connect dependency pod had an unexpected container restart within the restart window. |
Application Error Log Rate |
Degraded |
Any Connect service logged more error- or fatal-level events than the configured threshold within the restart window. |
| Only Flow Server issues (actuator down, pod crash-loop, or high flow-failure rate) can raise the overall status to Unhealthy, because Flow Server is what actually processes messages. Every other condition caps at Degraded. |
Deployments Health
The Deployments Health row shows health and version tables for Connect services and dependencies. It contains two panels:
Connect Services
A table that lists each Connect service, including Deployment Operator, Flow Server, Frontend, Frontend Configuration, Identity, Identity Flow Access Reconciler, Identity Management Reconciler, Identity mTLS Reconciler, Insights, and Resource Registry. For each service, the table shows the current Health status and deployed Version.
Connect Dependencies
A table that lists the dependencies used by Connect; Connect PostgreSQL, OpenBao, and VictoriaMetrics along with the current Health status and deployed Version.
The Health column in both panels is evaluated using the following states, listed in order of precedence:
| State | Fires when |
|---|---|
Unhealthy |
Fewer pods are ready than desired for that Deployment or StatefulSet, any of its pods are in |
Not Installed |
Kubernetes Deployment or StatefulSet for a Connect service is missing from the cluster but is required to be running, or a Connect dependency is absent. Connect PostgreSQL fires this state when absent while at least one enabled service is still configured to use the in-cluster database. |
⚠ Not Installed |
Kubernetes Deployment or StatefulSet is missing from the cluster, but it is optional or has been intentionally disabled in the Connect Helm chart configuration. Connect PostgreSQL shows this state when absent and every enabled service is configured to use an external database instead. |
Healthy |
All desired pods are ready and no crash loop is detected. |
Flow Server Deployment Status
The Flow Server Deployment Status row shows the number of flows deployed that are up or failing.
Deployed Flow Status (Up vs Failure)
A time-series chart that plots Connect flow deployment counts for the Up and Failure states over the selected time range, so you can see whether failures appeared suddenly or gradually.
-
Shows No data if flow deployment metric collection is disabled.
-
A rising
Failurecount feeds the Deployed Flows condition. See Health Signal Reference for details. -
Includes a See Flows in Connect Console link that opens the Connect Console Flows page.
Flow deployment failure reporting is enabled by default. To disable it, or to configure the failure ratio threshold that triggers an Unhealthy state, refer to the productHealth settings in the Connect Helm chart values.
|
Health Diagnostics
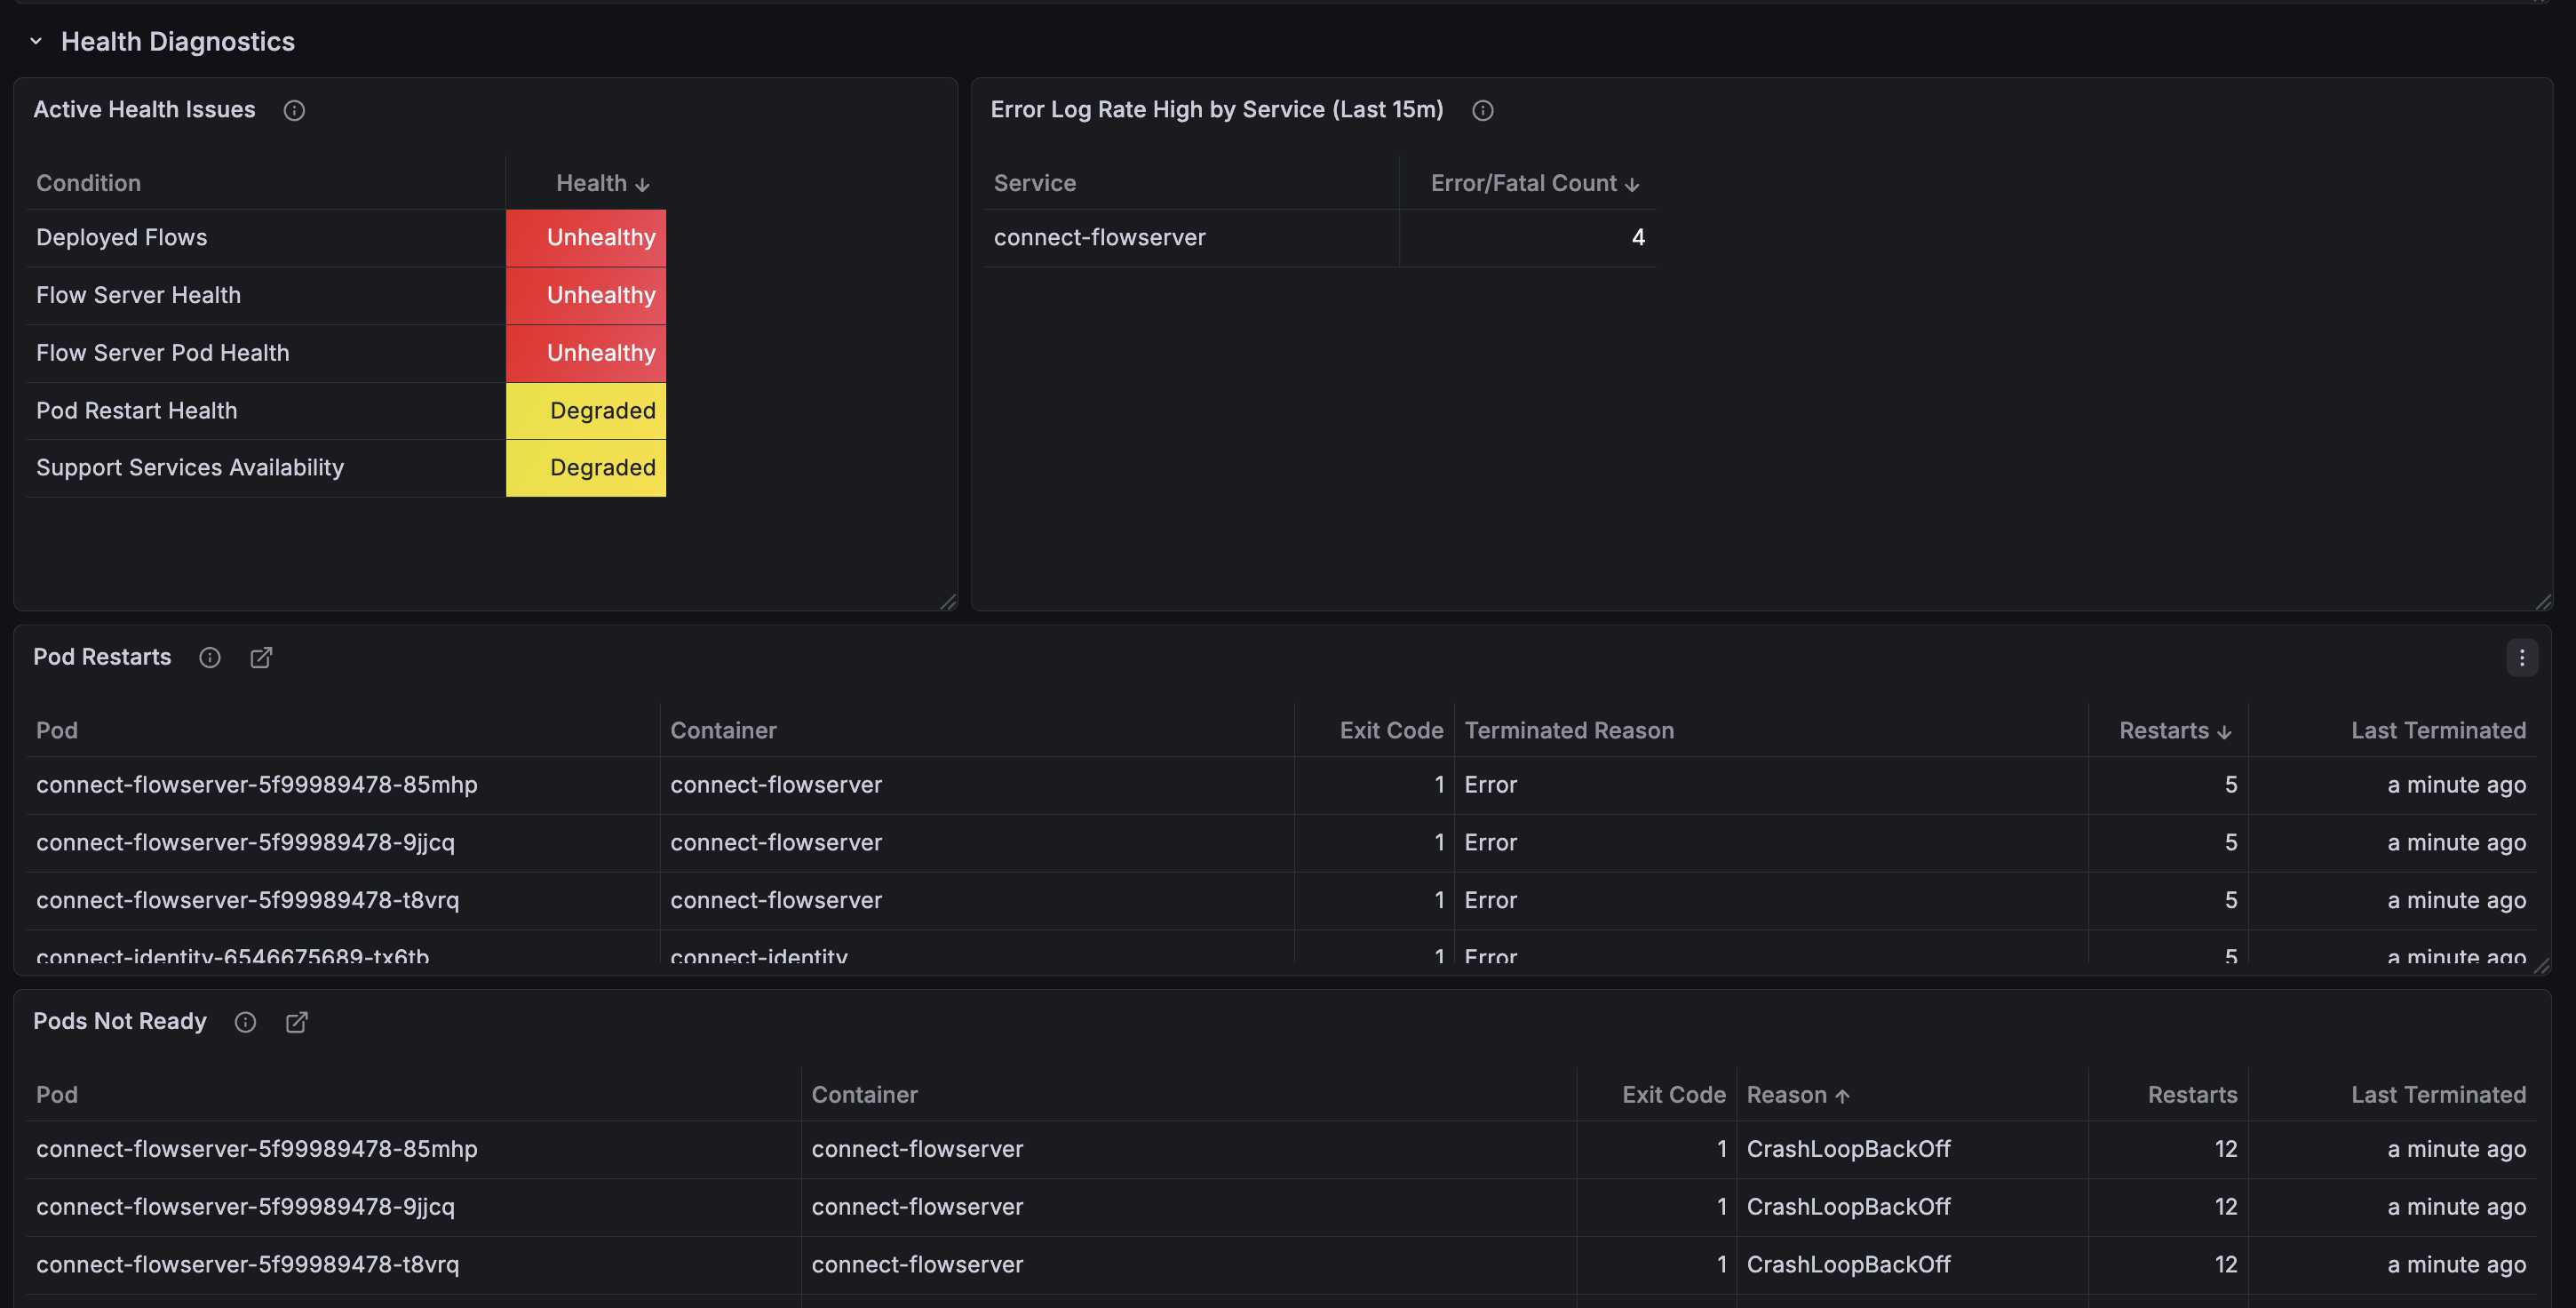
When the dashboard shows a Degraded or Unhealthy state, use the Health Diagnostics row to identify the root cause. It includes the Active Health Issues panel and the Error Log Rate High by Service, Pod Restarts, and Pods Not Ready panels for further detail.
Active Health Issues
The Active Health Issues panel shows which conditions are currently active. Use this panel first to identify the issue category. When no conditions are active, the panel displays All Components Healthy.
| State | Color | Meaning |
|---|---|---|
Unhealthy |
red |
One or more conditions are triggered and active at Unhealthy severity. |
Degraded |
yellow |
One or more conditions are triggered and active at Degraded severity. |
Healthy |
green |
All components are healthy: no conditions are active, and the product health metric is present. |
No Data |
transparent (no color) |
The Condition column shows Missing Health Metrics Data. This usually means the PrometheusRule for product health isn’t deployed or evaluating, but it can also indicate a different Prometheus or datasource issue. |
Error Log Rate High by Service
This panel shows a list of Connect services with their count of error- and fatal-level log events within the restart window (15 minutes by default). Only services with at least one event in the window are listed; the table is empty when none exceed the threshold. It feeds the Application Error Log Rate condition (see Health Signal Reference).
| Color | When |
|---|---|
transparent |
Count is below the configured error log rate threshold. |
yellow |
Count is at or above the configured error log rate threshold. |
The error log rate threshold and restart window are configurable. To adjust either value, refer to the productHealth settings in the Connect Helm chart values.
|
Pod Restarts
A list of Connect pods that have restarted unexpectedly within the selected dashboard time range, matching the Pod Restart Health condition. It shows a table of Pod, Container, Exit Code, Terminated Reason, Restarts count, and Last Terminated time, giving you a quick overview of failing pods so you can troubleshoot further with kubectl or similar tools.
The panel also includes a See Logs in Kibana link to the Kibana landing page (no filters pre-applied). Select the flowserver-logs data view for Flow Server pods, or connect-services for other Connect services, then filter by the affected pod. See View Connect Logs for details.
Pods Not Ready
This panel shows Connect pods or containers that are currently blocked from running, based on the Kubernetes pod container waiting status metric. Examples include ImagePullBackOff, CrashLoopBackOff, CreateContainerConfigError, and InvalidImageName.
It shows a table of Pod, Container, Reason, Exit Code, Restarts count, and Last Terminated time, giving you a quick overview of blocked pods so you can troubleshoot further with kubectl or similar tools.
The panel also includes a See Logs in Kibana link to the Kibana landing page (no filters pre-applied). Select the flowserver-logs data view for Flow Server pods, or connect-services for other Connect services, then filter by the affected pod. See View Connect Logs for details.
|
The Connect Product Health dashboard header includes links to related Grafana dashboards that open with the current time range:
Panel-level links (See Flows in Connect Console, See Logs in Kibana) open external tools and do not carry over the time range or filters. |