JVM Metrics
All microservices deployed as part of Connect expose standard JVM metrics, including memory usage, CPU utilization, and garbage collection statistics.
These metrics are available in the Spring Boot 2.3 Statistics dashboard included with Foundation. To view statistics for a specific Connect microservice, select the job that corresponds to that service (for example, connect-flowserver). Note that you can view only one instance or pod at a time.
While this dashboard provides detailed insight into JVM memory and garbage collection activity, it does not display the usage patterns or business metrics that influence them. They are helpful for investigating performance or stability issues when correlated with metrics from the Connect dashboard.
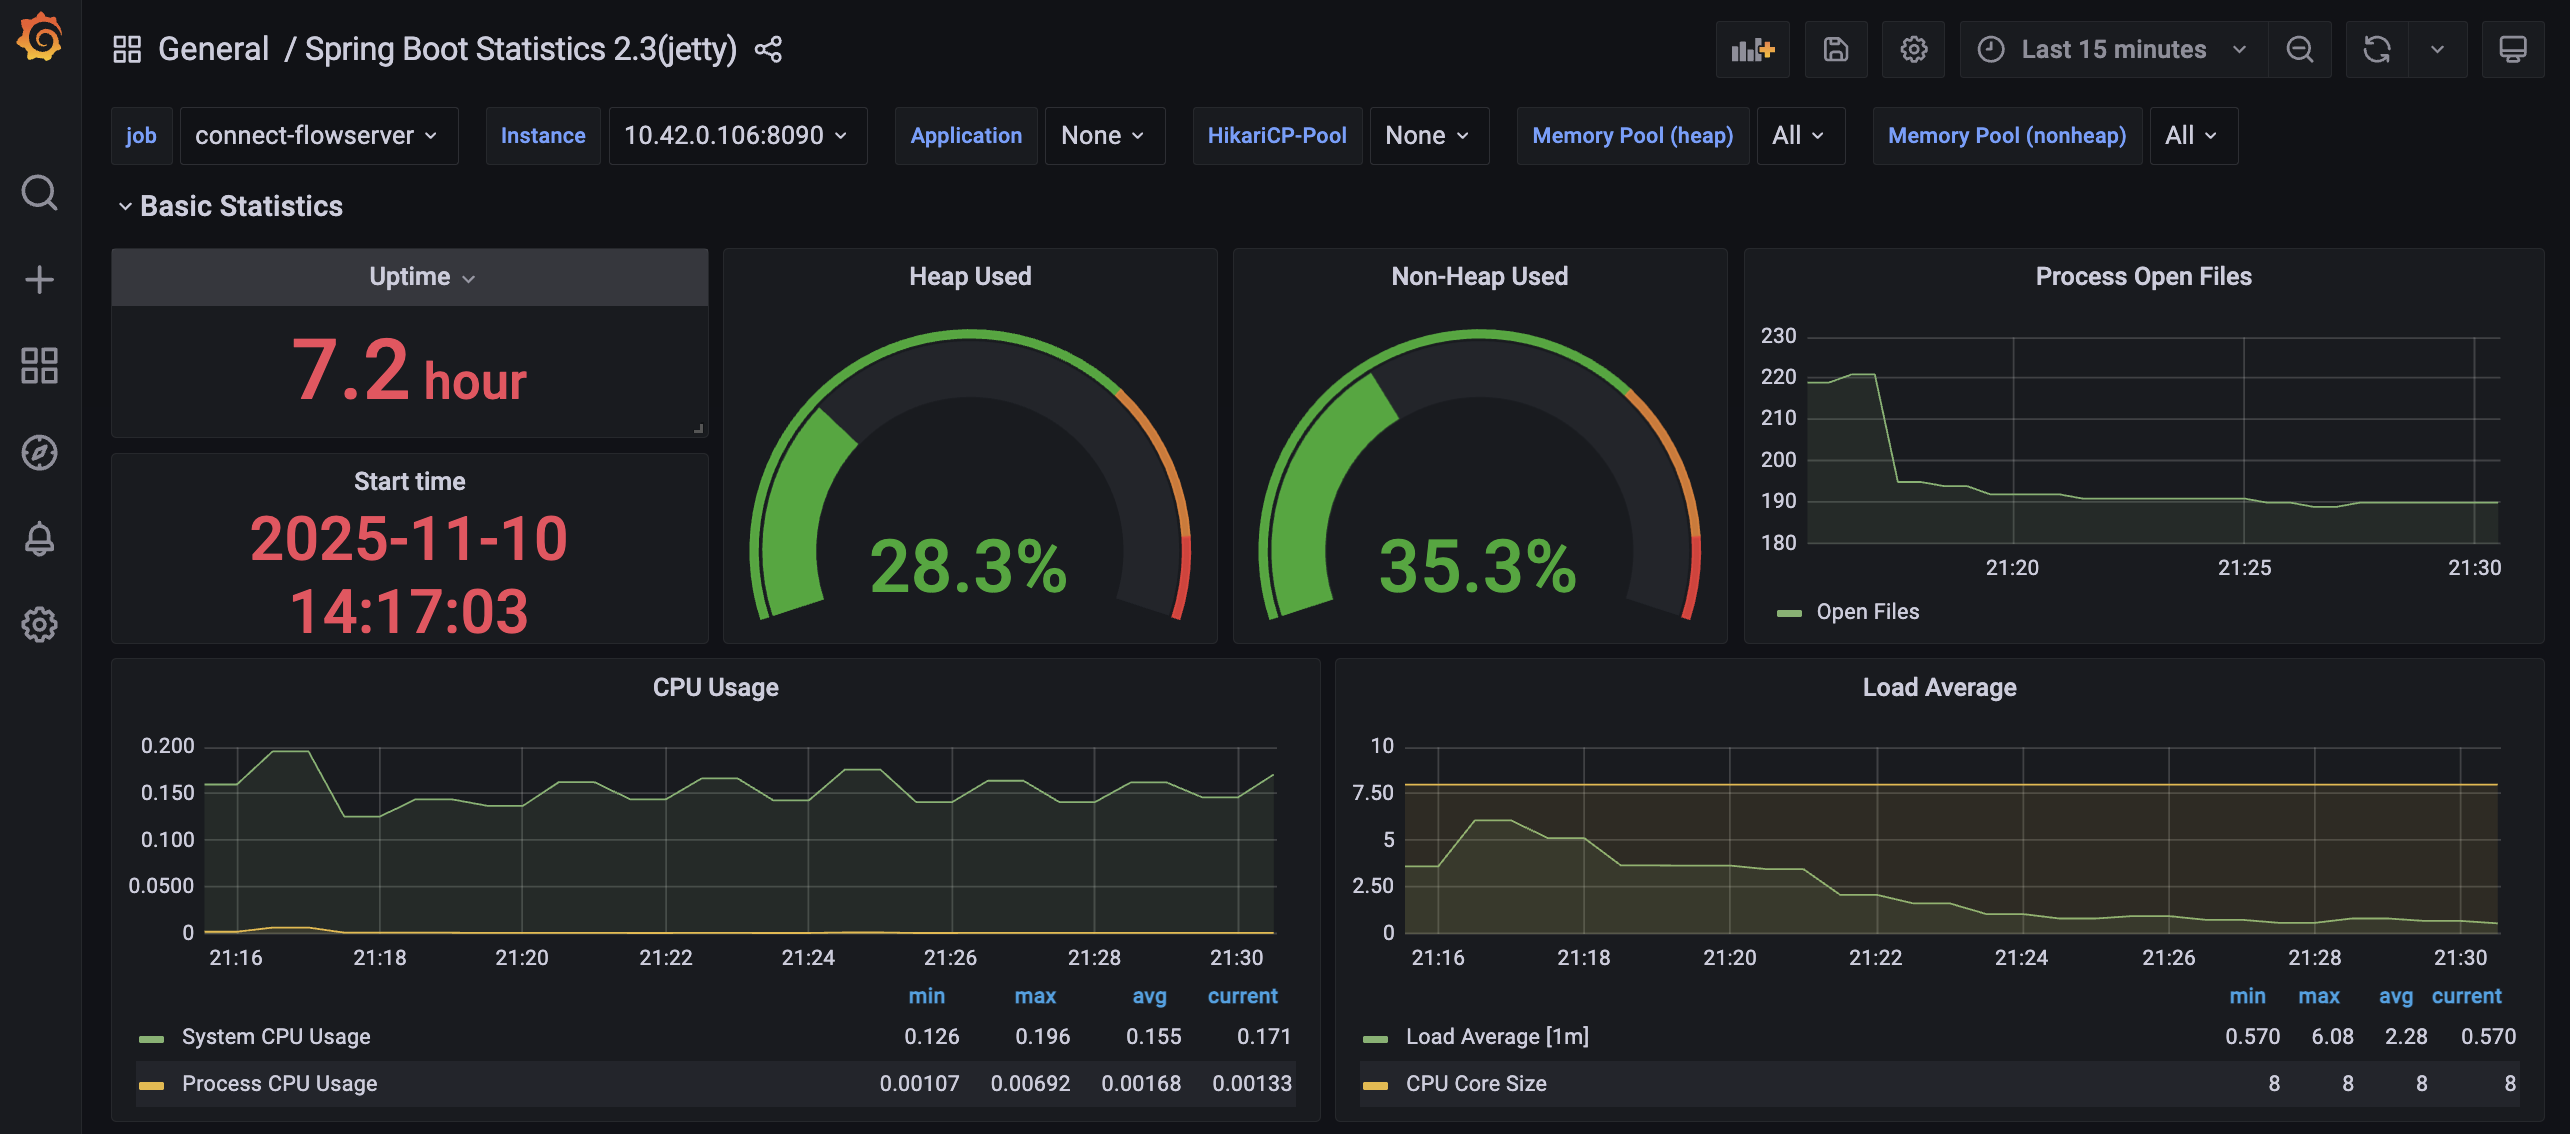
First part of the Spring Boot dashboard displays metrics for a Connect flow-server instance